Advertisements
Advertisements
Question
Four cars A, B, C and D are moving on a levelled, straight road. Their distance-time graphs are shown in the given figure. Which of the following is the correct statement regarding the motion of these cars?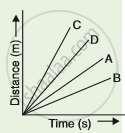
Options
car A is faster than car D
car B is the slowest
car D is faster than the car C
car C is the slowest
Advertisements
Solution
The slope of distance time graph gives the speed or the measure of rate of change of distance per unit time. So, the answer is,
(b) Car B is the slowest
APPEARS IN
RELATED QUESTIONS
The speed-time graph for a car is shown in the following figure:
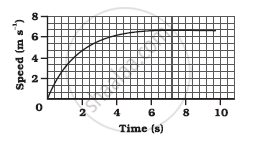
- Find how far the car travels in the first 4 seconds. Shade the area on the graph that represents the distance travelled by the car during the period.
- Which part of the graph represents uniform motion of the car?
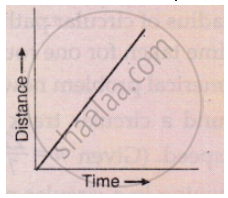
Show the shape of the distance-time graph for the motion in the following case:
A car moving with a constant speed.
What conclusion can you draw about the speed of a body from the following distance-time graph ?
Fill in the following blank with suitable word :
The slope of a distance-time graph indicates ………………….. of a moving body.
Name the two quantities, the slope of whose graph give speed .
A spaceship is moving in space with a velocity of 60 kms−1. It fires its retro engines for 20 seconds and velocity is reduced to 55 kms−1. Calculate the distance travelled by a spaceship in 40 s, from the time of firing of the retro- rockets.
What are the uses of the graphical study of motion?
If we denote speed by S, distance by D and time by T, the relationship between these quantities is ______.
Complete the data of the table given below with the help of the distance-time graph given in the figure.
| Distance (m) | 0 | 4 | ? | 12 | ? | 20 |
| Time (s) | 0 | 2 | 4 | ? | 8 | 10 |

Starting from A, Paheli moves along a rectangular path ABCD as shown in figure. She takes 2 minutes to travel each side. Plot a distance-time graph and explain whether the motion is uniform or non-uniform.

