Advertisements
Advertisements
Question
Fill in the following blank with suitable word :
The slope of a distance-time graph indicates ………………….. of a moving body.
Advertisements
Solution
The slope of a distance-time graph indicates speed of a moving body.
APPEARS IN
RELATED QUESTIONS
What can you say about the motion of an object whose distance-time graph is a straight line parallel to the time axis?
What can you say about the motion of an object if its speed-time graph is a straight line parallel to the time axis?
The speed-time graph for a car is shown in the following figure:
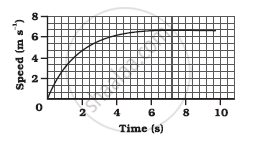
- Find how far the car travels in the first 4 seconds. Shade the area on the graph that represents the distance travelled by the car during the period.
- Which part of the graph represents uniform motion of the car?
Fill in the following blank with suitable word :
The slope of a speed-time graph of a moving body gives its………………………..
Name the two quantities, the slope of whose graph give speed .
A car is travelling at 20 m/s along a road. A child runs out into the road 50 m ahead and the car driver steps on the brake pedal. What must the car’s deceleration be if the car is to stop just before it reaches the child ?
Write down the type of motion of a body in each of the following distance time-graph.
Starting from A, Paheli moves along a rectangular path ABCD as shown in figure. She takes 2 minutes to travel each side. Plot a distance-time graph and explain whether the motion is uniform or non-uniform.

Assertion: The position-time graph of a uniform motion in one dimension of a body can have a negative slope
Reason: When the speed of the body decreases with time then, the position-time graph of the moving body has a negative slope.
Assertion: The slope of the distance-time graph of a body moving with high speed is steeper than the slope of the distance-time graph of a body with low velocity.
Reason: Slope of distance-time graph = speed of the body.
