Advertisements
Advertisements
प्रश्न
Fill in the following blank with suitable word :
The slope of a distance-time graph indicates ………………….. of a moving body.
Advertisements
उत्तर
The slope of a distance-time graph indicates speed of a moving body.
APPEARS IN
संबंधित प्रश्न
What is the nature of the distance-time graphs for uniform and non-uniform motion of an object?
Which of the following distance-time graphs shows a truck moving with speed which is not constant?
What does the slope of a distance-time graph indicate ?
What can you say about the motion of a body whose distance-time graph is a straight line parallel to the time axis ?
Name the two quantities, the slope of whose graph give speed .
A car is travelling at 20 m/s along a road. A child runs out into the road 50 m ahead and the car driver steps on the brake pedal. What must the car’s deceleration be if the car is to stop just before it reaches the child ?
Four cars A, B, C and D are moving on a levelled, straight road. Their distance-time graphs are shown in the given figure. Which of the following is the correct statement regarding the motion of these cars?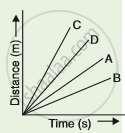
Write down the type of motion of a body in each of the following distance time-graph.
If we denote speed by S, distance by D and time by T, the relationship between these quantities is ______.
The slope of the distance-time curve is steeper/greater is the ______.
