Advertisements
Advertisements
Question
The speed-time graph for a car is shown in the following figure:
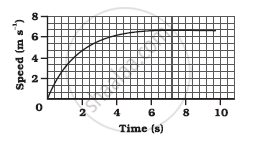
- Find how far the car travels in the first 4 seconds. Shade the area on the graph that represents the distance travelled by the car during the period.
- Which part of the graph represents uniform motion of the car?
Advertisements
Solution
The motion during the first 4 seconds is not uniformly accelerated. So, the distance travelled by car in the first 4 seconds is calculated using the graphical method.
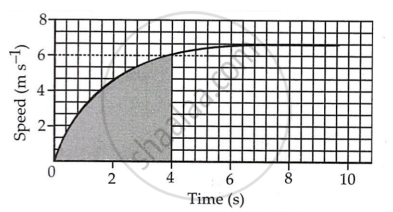
(a) Number of squares in the shaded part of the graph is 320.5
One small square m x-axis represents `t = 2/5 s`
One small square on the y-axis represents.
`v = 2/3 ms^-1`
∴ area of each square, `v xx t`
= `2/3 xx 2/5`
= `4/15 m`
Total area = `61.5 × 4/15`
= 16.4 m
(b) The limiting flat portion of the curve describes the constant speed of the car, i.e., a speed of 6.0 m s−1. At this stage, the acceleration of the car is zero.
Therefore, a portion of the graph between t = 6 s to 10 s, describes the uniform motion of the car.
APPEARS IN
RELATED QUESTIONS
What is the nature of the distance-time graphs for uniform and non-uniform motion of an object?
Figure shows the distance-time graph for the motion of two vehicles A and B. Which one of them is moving faster?
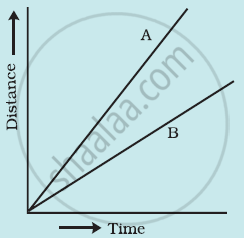
Figure: Distance-time graph for the motion of two cars
Fill in the following blank with suitable word :
The slope of a distance-time graph indicates ………………….. of a moving body.
Fill in the following blank with suitable word :
The slope of a speed-time graph of a moving body gives its………………………..
A student draws a distance-time graph for a moving scooter and finds that a section of the graph is horizontal line parallel to the time axis. Which of the following conclusion is correct about this section of the graph?
The slope of the distance-time graph at any point gives______.
What are the uses of the graphical study of motion?
Starting from A, Paheli moves along a rectangular path ABCD as shown in figure. She takes 2 minutes to travel each side. Plot a distance-time graph and explain whether the motion is uniform or non-uniform.

The slope of the distance-time curve is steeper/greater is the ______.
Assertion: The position-time graph of a uniform motion in one dimension of a body can have a negative slope
Reason: When the speed of the body decreases with time then, the position-time graph of the moving body has a negative slope.
