Advertisements
Advertisements
प्रश्न
The speed-time graph for a car is shown in the following figure:
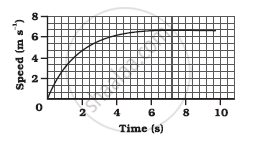
- Find how far the car travels in the first 4 seconds. Shade the area on the graph that represents the distance travelled by the car during the period.
- Which part of the graph represents uniform motion of the car?
Advertisements
उत्तर
The motion during the first 4 seconds is not uniformly accelerated. So, the distance travelled by car in the first 4 seconds is calculated using the graphical method.
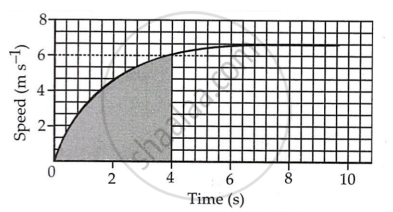
(a) Number of squares in the shaded part of the graph is 320.5
One small square m x-axis represents `t = 2/5 s`
One small square on the y-axis represents.
`v = 2/3 ms^-1`
∴ area of each square, `v xx t`
= `2/3 xx 2/5`
= `4/15 m`
Total area = `61.5 × 4/15`
= 16.4 m
(b) The limiting flat portion of the curve describes the constant speed of the car, i.e., a speed of 6.0 m s−1. At this stage, the acceleration of the car is zero.
Therefore, a portion of the graph between t = 6 s to 10 s, describes the uniform motion of the car.
APPEARS IN
संबंधित प्रश्न
What can you say about the motion of an object whose distance-time graph is a straight line parallel to the time axis?
What can you say about the motion of an object if its speed-time graph is a straight line parallel to the time axis?
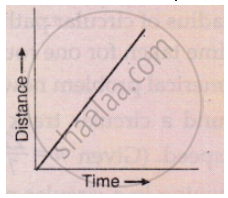
What conclusion can you draw about the speed of a body from the following distance-time graph ?
What can you say about the motion of a body whose distance-time graph is a straight line parallel to the time axis ?
Name the two quantities, the slope of whose graph give speed .
A student draws a distance-time graph for a moving scooter and finds that a section of the graph is horizontal line parallel to the time axis. Which of the following conclusion is correct about this section of the graph?
Figure (a) shows the displacement-time graph for the motion of a body. Use it to calculate the velocity of the body at t = 1 s, 2 s and 3 s, and then draw the velocity-time graph in Figure (b) for it.
 |
 |
| (a) | (b) |
Two friends leave Delhi for Chandigarh in their cars. A starts at 5 am and moves with a constant speed of 30 km/h, whereas B starts at 6 am and moves with a constant speed of 40 kmh-1. Plot the distance-time graph for their motion and find at what time the two friends will meet and at what distance from Delhi.
A body moves along a straight road with a speed of 20 m/s and has a uniform acceleration of 5 m/s2. What will be its speed after 2 s?
The slope of the distance-time curve is steeper/greater is the ______.
