Advertisements
Advertisements
प्रश्न
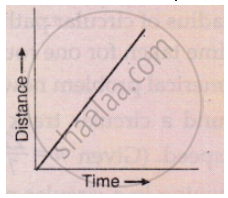
The slope of the distance-time graph at any point gives______.
Advertisements
उत्तर
The slope of the distance-time graph at any point gives speed
APPEARS IN
संबंधित प्रश्न
Show the shape of the distance-time graph for the motion in the following case:
A car moving with a constant speed.
Which of the following distance-time graphs shows a truck moving with speed which is not constant?
What conclusion can you draw about the speed of a body from the following distance-time graph ?
What can you say about the motion of a body whose distance-time graph is a straight line parallel to the time axis ?
Name the two quantities, the slope of whose graph give speed .
Four cars A, B, C and D are moving on a levelled, straight road. Their distance-time graphs are shown in the given figure. Which of the following is the correct statement regarding the motion of these cars?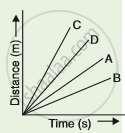
A student draws a distance-time graph for a moving scooter and finds that a section of the graph is horizontal line parallel to the time axis. Which of the following conclusion is correct about this section of the graph?
Figure (a) shows the displacement-time graph for the motion of a body. Use it to calculate the velocity of the body at t = 1 s, 2 s and 3 s, and then draw the velocity-time graph in Figure (b) for it.
 |
 |
| (a) | (b) |
A spaceship is moving in space with a velocity of 60 kms−1. It fires its retro engines for 20 seconds and velocity is reduced to 55 kms−1. Calculate the distance travelled by a spaceship in 40 s, from the time of firing of the retro- rockets.
The slope of the distance-time graph indicates the speed.
