Advertisements
Advertisements
प्रश्न
Distance between Bholu’s and Golu’s house is 9 km. Bholu has to attend Golu’s birthday party at 7 o’clock. He started from his home at 6 o’clock on his bicycle and covered a distance of 6 km in 40 minutes. At that point, he met Chintu and he spoke to him for 5 minutes and reached Golu’s birthday party at 7 o’clock. With what speed did he cover the second part of the journey? Calculate his average speed for the entire journey.
Advertisements
उत्तर
Distance between Bholu’s and Golu’s house = 9 km
Distance covered by Bholu in first part of the journey = 6 km
Time taken to cover 6 km = 40 min
Distance covered by Bholu in second part of the journey = 9 − 6 = 3 km
Time taken to cover 3 km = 60 – (40 + 5) = 15 min
Speed of Bholu while covering second part of the journey
= `(3 "km")/((15/60)"h")`
= 12 km/h
Average speed of Bholu for the entire journey
= `("Total distance")/("Time taken")`
= `(9 "km")/(60 "min")`
= 9 km/h
APPEARS IN
संबंधित प्रश्न
What can you say about the motion of an object if its speed-time graph is a straight line parallel to the time axis?
The speed-time graph for a car is shown in the following figure:
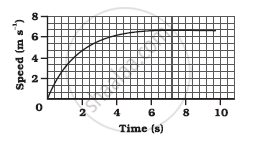
- Find how far the car travels in the first 4 seconds. Shade the area on the graph that represents the distance travelled by the car during the period.
- Which part of the graph represents uniform motion of the car?
What conclusion can you draw about the speed of a body from the following distance-time graph ?
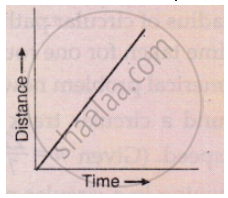
Name the two quantities, the slope of whose graph give speed .
A cyclist is travelling at 15 m s-1. She applies brakes so that she does not collide with a wall 18 m away. What deceleration must she have ?
Four cars A, B, C and D are moving on a levelled, straight road. Their distance-time graphs are shown in the given figure. Which of the following is the correct statement regarding the motion of these cars?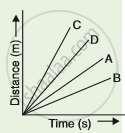
What are the uses of the graphical study of motion?
Starting from A, Paheli moves along a rectangular path ABCD as shown in figure. She takes 2 minutes to travel each side. Plot a distance-time graph and explain whether the motion is uniform or non-uniform.

The area under velocity time graph represents ______.
Assertion: The slope of the distance-time graph of a body moving with high speed is steeper than the slope of the distance-time graph of a body with low velocity.
Reason: Slope of distance-time graph = speed of the body.
