Advertisements
Advertisements
Question
Distance between Bholu’s and Golu’s house is 9 km. Bholu has to attend Golu’s birthday party at 7 o’clock. He started from his home at 6 o’clock on his bicycle and covered a distance of 6 km in 40 minutes. At that point, he met Chintu and he spoke to him for 5 minutes and reached Golu’s birthday party at 7 o’clock. With what speed did he cover the second part of the journey? Calculate his average speed for the entire journey.
Advertisements
Solution
Distance between Bholu’s and Golu’s house = 9 km
Distance covered by Bholu in first part of the journey = 6 km
Time taken to cover 6 km = 40 min
Distance covered by Bholu in second part of the journey = 9 − 6 = 3 km
Time taken to cover 3 km = 60 – (40 + 5) = 15 min
Speed of Bholu while covering second part of the journey
= `(3 "km")/((15/60)"h")`
= 12 km/h
Average speed of Bholu for the entire journey
= `("Total distance")/("Time taken")`
= `(9 "km")/(60 "min")`
= 9 km/h
APPEARS IN
RELATED QUESTIONS
What can you say about the motion of an object whose distance-time graph is a straight line parallel to the time axis?
Figure shows the distance-time graph for the motion of two vehicles A and B. Which one of them is moving faster?
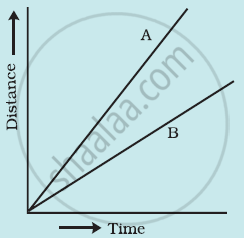
Figure: Distance-time graph for the motion of two cars
Which of the following distance-time graphs shows a truck moving with speed which is not constant?
What does the slope of a distance-time graph indicate ?
A cyclist is travelling at 15 m s-1. She applies brakes so that she does not collide with a wall 18 m away. What deceleration must she have ?
A student draws a distance-time graph for a moving scooter and finds that a section of the graph is horizontal line parallel to the time axis. Which of the following conclusion is correct about this section of the graph?
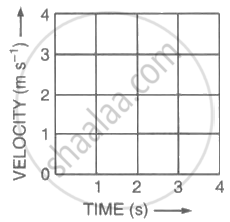
Figure (a) shows the displacement-time graph for the motion of a body. Use it to calculate the velocity of the body at t = 1 s, 2 s and 3 s, and then draw the velocity-time graph in Figure (b) for it.
 |
 |
| (a) | (b) |
Show the shape of the distance – time graph for the motion in the following cases.
- A bus moving with a constant speed.
- A car parked on a road side.
What are the uses of the graphical study of motion?
Assertion: The position-time graph of a uniform motion in one dimension of a body can have a negative slope
Reason: When the speed of the body decreases with time then, the position-time graph of the moving body has a negative slope.
