Advertisements
Advertisements
Question
Figure (a) shows the displacement-time graph for the motion of a body. Use it to calculate the velocity of the body at t = 1 s, 2 s and 3 s, and then draw the velocity-time graph in Figure (b) for it.
 |
 |
| (a) | (b) |
Advertisements
Solution
We observe from the given displacement time graph above, that the slope is a straight line inclined with time axis, so the body is moving with uniform velocity.
velocity = Slope of straight line
t = 1; velocity = `2/1` = 2 m/s
t = 2; velocity = `4/2` = 2 m/s
t = 3; velocity = `6/3` = 2 m/s
Hence, velocity at t = 1 s, 2 s and 3 s is equal to 2 m s-1
Velocity-time graph for the motion of a body is given below:

APPEARS IN
RELATED QUESTIONS
What can you say about the motion of an object whose distance-time graph is a straight line parallel to the time axis?
Figure shows the distance-time graph for the motion of two vehicles A and B. Which one of them is moving faster?
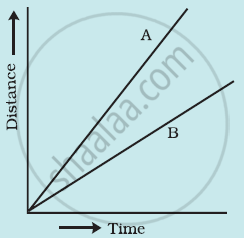
Figure: Distance-time graph for the motion of two cars
Which of the following distance-time graphs shows a truck moving with speed which is not constant?
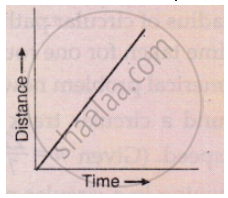
What conclusion can you draw about the speed of a body from the following distance-time graph ?
Name the two quantities, the slope of whose graph give speed .
A cyclist is travelling at 15 m s-1. She applies brakes so that she does not collide with a wall 18 m away. What deceleration must she have ?
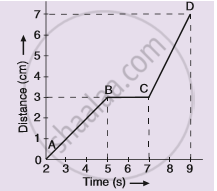
The graph given alongside shows the positions of a body at different times. Calculate the speed of the body as it moves from :
(1) A to B,
(2) B to C, and
(3) C to D.
A body moves along a straight road with a speed of 20 m/s and has a uniform acceleration of 5 m/s2. What will be its speed after 2 s?
If we denote speed by S, distance by D and time by T, the relationship between these quantities is ______.
The slope of the distance-time curve is steeper/greater is the ______.
