Advertisements
Advertisements
Question
What can you say about the motion of an object whose distance-time graph is a straight line parallel to the time axis?
Advertisements
Solution
When an object is at rest, its distance-time graph is a straight line parallel to the time axis.
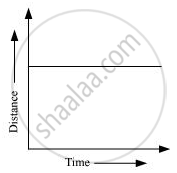
A straight line parallel to the x-axis in a distance-time graph indicates that with a change in time, there is no change in the position of the object. Thus, the object is at rest.
RELATED QUESTIONS
A driver of a car travelling at 52 km h−1 applies the brakes and accelerates uniformly in the opposite direction. The car stops in 5 s. Another driver going at 3 km h−1 in another car applies his brakes slowly and stops in 10 s. On the same graph paper, plot the speed versus time graphs for the two cars. Which of the two cars travelled farther after the brakes were applied?
Which of the following distance-time graphs shows a truck moving with speed which is not constant?
Fill in the following blank with suitable word :
The slope of a speed-time graph of a moving body gives its………………………..
Name the two quantities, the slope of whose graph give speed .
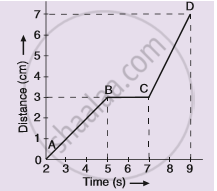
The graph given alongside shows the positions of a body at different times. Calculate the speed of the body as it moves from :
(1) A to B,
(2) B to C, and
(3) C to D.
A car is travelling at 20 m/s along a road. A child runs out into the road 50 m ahead and the car driver steps on the brake pedal. What must the car’s deceleration be if the car is to stop just before it reaches the child ?
A student draws a distance-time graph for a moving scooter and finds that a section of the graph is horizontal line parallel to the time axis. Which of the following conclusion is correct about this section of the graph?
Write down the type of motion of a body in each of the following distance time-graph.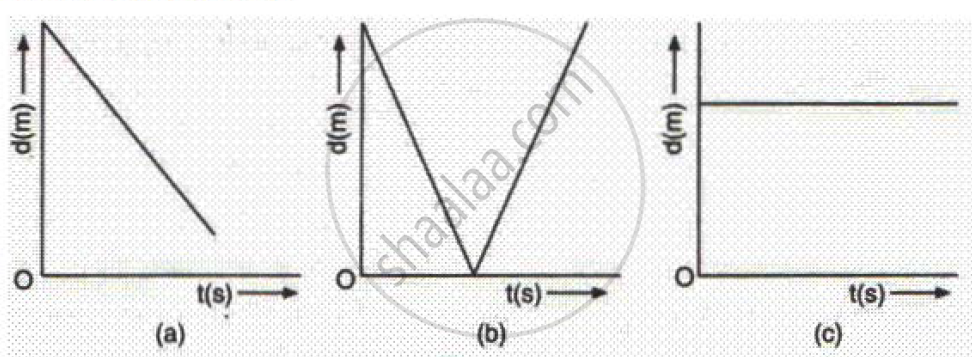
The slope of the distance-time graph indicates the speed.
Assertion: The position-time graph of a uniform motion in one dimension of a body can have a negative slope
Reason: When the speed of the body decreases with time then, the position-time graph of the moving body has a negative slope.
