Advertisements
Advertisements
Question
Two friends leave Delhi for Chandigarh in their cars. A starts at 5 am and moves with a constant speed of 30 km/h, whereas B starts at 6 am and moves with a constant speed of 40 kmh-1. Plot the distance-time graph for their motion and find at what time the two friends will meet and at what distance from Delhi.
Advertisements
Solution
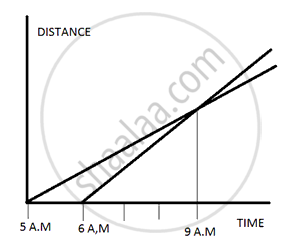
So we can see that the two friends wiil meet at 9 a.m ant till then they cover a distance of u x t = u' xt' = 30 x4 = 40 x 3 =120 km So they are 120 km away from Delhi when they meet at 9 a.m.
APPEARS IN
RELATED QUESTIONS
Show the shape of the distance-time graph for the motion in the following case:
A car parked on a side road.
What can you say about the motion of a body whose distance-time graph is a straight line parallel to the time axis ?
Four cars A, B, C and D are moving on a levelled, straight road. Their distance-time graphs are shown in the given figure. Which of the following is the correct statement regarding the motion of these cars?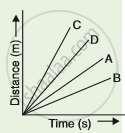
Write down the type of motion of a body in each of the following distance time-graph.
Show the shape of the distance – time graph for the motion in the following cases.
- A bus moving with a constant speed.
- A car parked on a road side.
The slope of the distance-time graph at any point gives______.
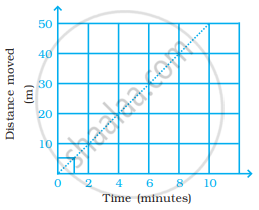
Two students were asked to plot a distance-time graph for the motion described by Table A and Table B.
| Table A |
||||||
| Distance moved (m) | 0 | 10 | 20 | 30 | 40 | 50 |
| Time (minutes) | 0 | 2 | 4 | 6 | 8 | 10 |
| Table B |
||||||
| Distance moved (m) | 0 | 5 | 10 | 15 | 20 | 25 |
| Time (minutes) | 0 | 1 | 2 | 3 | 4 | 5 |
The graph given in figure is true for
The area under velocity time graph represents ______.
The slope of the distance-time graph indicates the speed.
What do you infer if
- Distance – time graph is a straight line.
- The velocity-time graph is curved.
- Displacement time is zigzag.
