Advertisements
Advertisements
Question
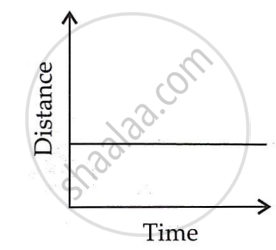
Show the shape of the distance-time graph for the motion in the following case:
A car parked on a side road.
Advertisements
Solution
The distance-time graph of a car parked on a roadside is such that with the increase in time, there is no change in distance, as shown in the given figure.
APPEARS IN
RELATED QUESTIONS
What does the slope of a distance-time graph indicate ?
Fill in the following blank with suitable word :
The slope of a speed-time graph of a moving body gives its………………………..
A cyclist is travelling at 15 m s-1. She applies brakes so that she does not collide with a wall 18 m away. What deceleration must she have ?
Two friends leave Delhi for Chandigarh in their cars. A starts at 5 am and moves with a constant speed of 30 km/h, whereas B starts at 6 am and moves with a constant speed of 40 kmh-1. Plot the distance-time graph for their motion and find at what time the two friends will meet and at what distance from Delhi.
A body moves along a straight road with a speed of 20 m/s and has a uniform acceleration of 5 m/s2. What will be its speed after 2 s?
What are the uses of the graphical study of motion?
Complete the data of the table given below with the help of the distance-time graph given in the figure.
| Distance (m) | 0 | 4 | ? | 12 | ? | 20 |
| Time (s) | 0 | 2 | 4 | ? | 8 | 10 |

Starting from A, Paheli moves along a rectangular path ABCD as shown in figure. She takes 2 minutes to travel each side. Plot a distance-time graph and explain whether the motion is uniform or non-uniform.

Boojho goes to the football ground to play football. The distance-time graph of his journey from his home to the ground is given in the figure.
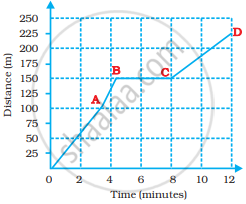
- What does the graph between points B and C indicate about the motion of Boojho?
- Is the motion between 0 to 4 minutes uniform or non-uniform?
- What is his speed between 8 and 12 minutes of his journey?
What do you infer if
- Distance – time graph is a straight line.
- The velocity-time graph is curved.
- Displacement time is zigzag.
