Advertisements
Advertisements
प्रश्न
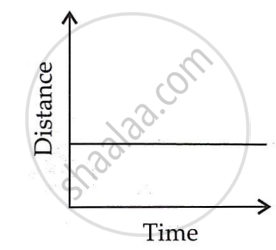
Show the shape of the distance-time graph for the motion in the following case:
A car parked on a side road.
Advertisements
उत्तर
The distance-time graph of a car parked on a roadside is such that with the increase in time, there is no change in distance, as shown in the given figure.
APPEARS IN
संबंधित प्रश्न
What is the nature of the distance-time graphs for uniform and non-uniform motion of an object?
What can you say about the motion of an object whose distance-time graph is a straight line parallel to the time axis?
A driver of a car travelling at 52 km h−1 applies the brakes and accelerates uniformly in the opposite direction. The car stops in 5 s. Another driver going at 3 km h−1 in another car applies his brakes slowly and stops in 10 s. On the same graph paper, plot the speed versus time graphs for the two cars. Which of the two cars travelled farther after the brakes were applied?
The speed-time graph for a car is shown in the following figure:
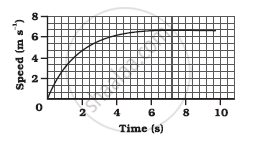
- Find how far the car travels in the first 4 seconds. Shade the area on the graph that represents the distance travelled by the car during the period.
- Which part of the graph represents uniform motion of the car?
Show the shape of the distance-time graph for the motion in the following case:
A car moving with a constant speed.
Figure shows the distance-time graph for the motion of two vehicles A and B. Which one of them is moving faster?
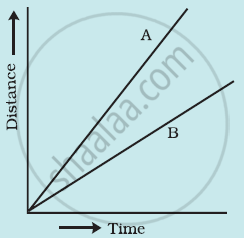
Figure: Distance-time graph for the motion of two cars
What can you say about the motion of a body whose distance-time graph is a straight line parallel to the time axis ?
A cyclist is travelling at 15 m s-1. She applies brakes so that she does not collide with a wall 18 m away. What deceleration must she have ?
Write down the type of motion of a body in each of the following distance time-graph.
The slope of the distance-time graph at any point gives______.
