Advertisements
Advertisements
प्रश्न
Figure shows the distance-time graph for the motion of two vehicles A and B. Which one of them is moving faster?
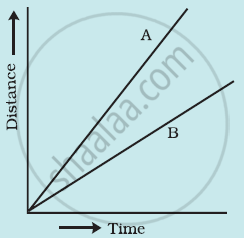
Figure: Distance-time graph for the motion of two cars
Advertisements
उत्तर
The speed is given by the relation
speed = `" distance travelled" / "time taken"`
This relation shows that the speed of a vehicle is high if it covers the maximum distance in a given time interval. To compare the distance, draw a line perpendicular to the time axis, as shown in the following distance-time graph

The graph clearly shows that for a given time t, vehicle A covers more distance than vehicle B. So, vehicle A is moving faster than vehicle B.
APPEARS IN
संबंधित प्रश्न
Show the shape of the distance-time graph for the motion in the following case:
A car moving with a constant speed.
Show the shape of the distance-time graph for the motion in the following case:
A car parked on a side road.
Which of the following distance-time graphs shows a truck moving with speed which is not constant?
Fill in the following blank with suitable word :
The slope of a speed-time graph of a moving body gives its………………………..
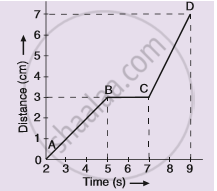
The graph given alongside shows the positions of a body at different times. Calculate the speed of the body as it moves from :
(1) A to B,
(2) B to C, and
(3) C to D.
Four cars A, B, C and D are moving on a levelled, straight road. Their distance-time graphs are shown in the given figure. Which of the following is the correct statement regarding the motion of these cars?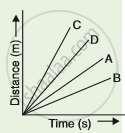
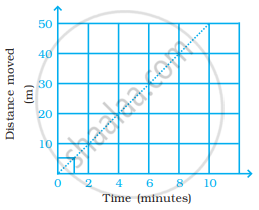
Two students were asked to plot a distance-time graph for the motion described by Table A and Table B.
| Table A |
||||||
| Distance moved (m) | 0 | 10 | 20 | 30 | 40 | 50 |
| Time (minutes) | 0 | 2 | 4 | 6 | 8 | 10 |
| Table B |
||||||
| Distance moved (m) | 0 | 5 | 10 | 15 | 20 | 25 |
| Time (minutes) | 0 | 1 | 2 | 3 | 4 | 5 |
The graph given in figure is true for
If we denote speed by S, distance by D and time by T, the relationship between these quantities is ______.
Complete the data of the table given below with the help of the distance-time graph given in the figure.
| Distance (m) | 0 | 4 | ? | 12 | ? | 20 |
| Time (s) | 0 | 2 | 4 | ? | 8 | 10 |

The slope of the distance-time curve is steeper/greater is the ______.
