Advertisements
Advertisements
प्रश्न
Figure shows the distance-time graph for the motion of two vehicles A and B. Which one of them is moving faster?
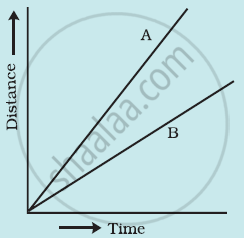
Figure: Distance-time graph for the motion of two cars
Advertisements
उत्तर
The speed is given by the relation
speed = `" distance travelled" / "time taken"`
This relation shows that the speed of a vehicle is high if it covers the maximum distance in a given time interval. To compare the distance, draw a line perpendicular to the time axis, as shown in the following distance-time graph

The graph clearly shows that for a given time t, vehicle A covers more distance than vehicle B. So, vehicle A is moving faster than vehicle B.
APPEARS IN
संबंधित प्रश्न
A driver of a car travelling at 52 km h−1 applies the brakes and accelerates uniformly in the opposite direction. The car stops in 5 s. Another driver going at 3 km h−1 in another car applies his brakes slowly and stops in 10 s. On the same graph paper, plot the speed versus time graphs for the two cars. Which of the two cars travelled farther after the brakes were applied?
Show the shape of the distance-time graph for the motion in the following case:
A car parked on a side road.
What can you say about the motion of a body whose distance-time graph is a straight line parallel to the time axis ?
Fill in the following blank with suitable word :
The slope of a speed-time graph of a moving body gives its………………………..
Four cars A, B, C and D are moving on a levelled, straight road. Their distance-time graphs are shown in the given figure. Which of the following is the correct statement regarding the motion of these cars?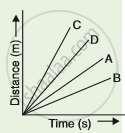
A student draws a distance-time graph for a moving scooter and finds that a section of the graph is horizontal line parallel to the time axis. Which of the following conclusion is correct about this section of the graph?
Complete the data of the table given below with the help of the distance-time graph given in the figure.
| Distance (m) | 0 | 4 | ? | 12 | ? | 20 |
| Time (s) | 0 | 2 | 4 | ? | 8 | 10 |

Distance between Bholu’s and Golu’s house is 9 km. Bholu has to attend Golu’s birthday party at 7 o’clock. He started from his home at 6 o’clock on his bicycle and covered a distance of 6 km in 40 minutes. At that point, he met Chintu and he spoke to him for 5 minutes and reached Golu’s birthday party at 7 o’clock. With what speed did he cover the second part of the journey? Calculate his average speed for the entire journey.
The area under velocity time graph represents ______.
Assertion: The slope of the distance-time graph of a body moving with high speed is steeper than the slope of the distance-time graph of a body with low velocity.
Reason: Slope of distance-time graph = speed of the body.
