Advertisements
Advertisements
प्रश्न
A driver of a car travelling at 52 km h−1 applies the brakes and accelerates uniformly in the opposite direction. The car stops in 5 s. Another driver going at 3 km h−1 in another car applies his brakes slowly and stops in 10 s. On the same graph paper, plot the speed versus time graphs for the two cars. Which of the two cars travelled farther after the brakes were applied?
Advertisements
उत्तर
The data given in this numerical problem are in different units. So, we should first convert km h-1 unit into m s-1 unit.
For first car:
Initial velocity u = 52 km h-1
= `(52 "km")/(1 "h")`
= `(52 xx 1000 "m")/(1 xx 3600 "s")`
= 14.4 s-1
Final velocity, v = 0 km h-1 = 0.0 m s-1
Time taken, t = 5s
For second car:
Initial velocity, u = 3 km h-1
= `(3 "km")/(1"h")`
= `(3 xx 1000 "m")/(1 xx 3600 "s")`
= 0.8 ms-1
Final velocity, v = 0 km h-1 = 0.0 m s-1
Time taken, t = 10s
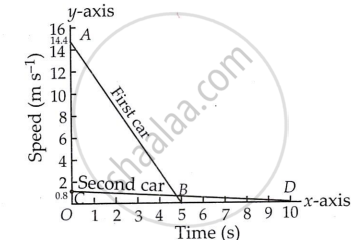
The area under a moving body's speed-time graph indicates the distance it has traveled.
So, Distance travelled by the first car = Area of the triangle AOB
= `1/2 xx "OB" xx "AO"`
= `1/2 xx 14.4` ms-1 × 5s
= `1/2 xx 14.4 xx 5 "m"`
= 36 m
Similarly, distance travelled by the second car = area of triangle COD.
= `1/2 xx "OD" xx "CO"`
= `1/2 xx 0.83 m s^-1 xx 10 s`
= `1/2 xx 0.83 xx 10 "m"`
= 4.1 m
Thus, the second car travels 4.1 m and the first car travels 36 m before coming to rest.
So, the first car travelled farther after the brakes were applied.
संबंधित प्रश्न
What can you say about the motion of an object whose distance-time graph is a straight line parallel to the time axis?
What can you say about the motion of an object if its speed-time graph is a straight line parallel to the time axis?
Which of the following distance-time graphs shows a truck moving with speed which is not constant?
What can you say about the motion of a body whose distance-time graph is a straight line parallel to the time axis ?
Fill in the following blank with suitable word :
The slope of a distance-time graph indicates ………………….. of a moving body.
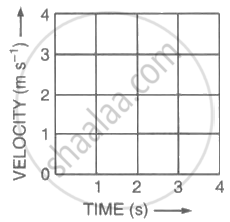
Figure (a) shows the displacement-time graph for the motion of a body. Use it to calculate the velocity of the body at t = 1 s, 2 s and 3 s, and then draw the velocity-time graph in Figure (b) for it.
 |
 |
| (a) | (b) |
Two friends leave Delhi for Chandigarh in their cars. A starts at 5 am and moves with a constant speed of 30 km/h, whereas B starts at 6 am and moves with a constant speed of 40 kmh-1. Plot the distance-time graph for their motion and find at what time the two friends will meet and at what distance from Delhi.
Show the shape of the distance – time graph for the motion in the following cases.
- A bus moving with a constant speed.
- A car parked on a road side.
What are the uses of the graphical study of motion?
Two students were asked to plot a distance-time graph for the motion described by Table A and Table B.
| Table A |
||||||
| Distance moved (m) | 0 | 10 | 20 | 30 | 40 | 50 |
| Time (minutes) | 0 | 2 | 4 | 6 | 8 | 10 |
| Table B |
||||||
| Distance moved (m) | 0 | 5 | 10 | 15 | 20 | 25 |
| Time (minutes) | 0 | 1 | 2 | 3 | 4 | 5 |
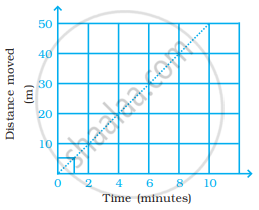
The graph given in figure is true for
