Advertisements
Advertisements
प्रश्न
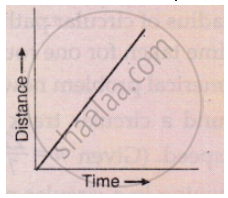
What conclusion can you draw about the speed of a body from the following distance-time graph ?
Advertisements
उत्तर
The body has a uniform speed because the body covers equal distance in equal interval of time.
APPEARS IN
संबंधित प्रश्न
What can you say about the motion of an object if its speed-time graph is a straight line parallel to the time axis?
Show the shape of the distance-time graph for the motion in the following case:
A car moving with a constant speed.
Show the shape of the distance-time graph for the motion in the following case:
A car parked on a side road.
What can you say about the motion of a body whose distance-time graph is a straight line parallel to the time axis ?
Name the two quantities, the slope of whose graph give speed .
A car is travelling at 20 m/s along a road. A child runs out into the road 50 m ahead and the car driver steps on the brake pedal. What must the car’s deceleration be if the car is to stop just before it reaches the child ?
A spaceship is moving in space with a velocity of 60 kms−1. It fires its retro engines for 20 seconds and velocity is reduced to 55 kms−1. Calculate the distance travelled by a spaceship in 40 s, from the time of firing of the retro- rockets.
Write down the type of motion of a body in each of the following distance time-graph.
Distance between Bholu’s and Golu’s house is 9 km. Bholu has to attend Golu’s birthday party at 7 o’clock. He started from his home at 6 o’clock on his bicycle and covered a distance of 6 km in 40 minutes. At that point, he met Chintu and he spoke to him for 5 minutes and reached Golu’s birthday party at 7 o’clock. With what speed did he cover the second part of the journey? Calculate his average speed for the entire journey.
The slope of the distance-time curve is steeper/greater is the ______.
