Advertisements
Advertisements
प्रश्न
Name the two quantities, the slope of whose graph give speed .
Advertisements
उत्तर
The slope of the graph of distance v/s time gives speed.
APPEARS IN
संबंधित प्रश्न
Show the shape of the distance-time graph for the motion in the following case:
A car moving with a constant speed.
Show the shape of the distance-time graph for the motion in the following case:
A car parked on a side road.
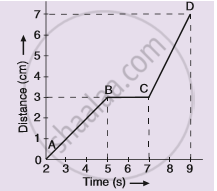
The graph given alongside shows the positions of a body at different times. Calculate the speed of the body as it moves from :
(1) A to B,
(2) B to C, and
(3) C to D.
Four cars A, B, C and D are moving on a levelled, straight road. Their distance-time graphs are shown in the given figure. Which of the following is the correct statement regarding the motion of these cars?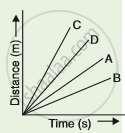
Write down the type of motion of a body in each of the following distance time-graph.
The slope of the distance-time graph at any point gives______.
Distance between Bholu’s and Golu’s house is 9 km. Bholu has to attend Golu’s birthday party at 7 o’clock. He started from his home at 6 o’clock on his bicycle and covered a distance of 6 km in 40 minutes. At that point, he met Chintu and he spoke to him for 5 minutes and reached Golu’s birthday party at 7 o’clock. With what speed did he cover the second part of the journey? Calculate his average speed for the entire journey.
The slope of the distance-time graph indicates the speed.
Assertion: The position-time graph of a uniform motion in one dimension of a body can have a negative slope
Reason: When the speed of the body decreases with time then, the position-time graph of the moving body has a negative slope.
Assertion: The slope of the distance-time graph of a body moving with high speed is steeper than the slope of the distance-time graph of a body with low velocity.
Reason: Slope of distance-time graph = speed of the body.
