Advertisements
Advertisements
प्रश्न
Write down the type of motion of a body in each of the following distance time-graph.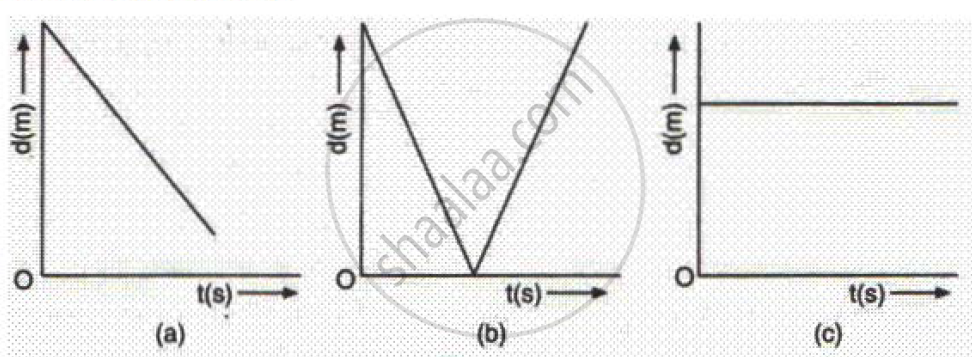
Advertisements
उत्तर

(i) The body is showing decreasing velocity that is retardation.
(ii) Initially, the body is showing retarded motion and then an accelerating one.
(iii) The body is in the state of rest.
APPEARS IN
संबंधित प्रश्न
What is the nature of the distance-time graphs for uniform and non-uniform motion of an object?
Given figure shows the distance-time graph of three objects A, B and C. Study the graph and answer the following questions:
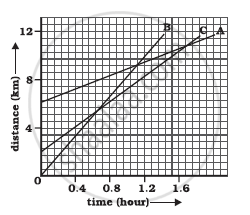
- Which of the three is travelling the fastest?
- Are all three ever at the same point on the road?
- How far has C travelled when B passes A?
- How far has B travelled by the time it passes C?
Show the shape of the distance-time graph for the motion in the following case:
A car parked on a side road.
A car is travelling at 20 m/s along a road. A child runs out into the road 50 m ahead and the car driver steps on the brake pedal. What must the car’s deceleration be if the car is to stop just before it reaches the child ?
Four cars A, B, C and D are moving on a levelled, straight road. Their distance-time graphs are shown in the given figure. Which of the following is the correct statement regarding the motion of these cars?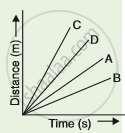
A student draws a distance-time graph for a moving scooter and finds that a section of the graph is horizontal line parallel to the time axis. Which of the following conclusion is correct about this section of the graph?
The slope of the distance-time graph at any point gives______.
Two students were asked to plot a distance-time graph for the motion described by Table A and Table B.
| Table A |
||||||
| Distance moved (m) | 0 | 10 | 20 | 30 | 40 | 50 |
| Time (minutes) | 0 | 2 | 4 | 6 | 8 | 10 |
| Table B |
||||||
| Distance moved (m) | 0 | 5 | 10 | 15 | 20 | 25 |
| Time (minutes) | 0 | 1 | 2 | 3 | 4 | 5 |
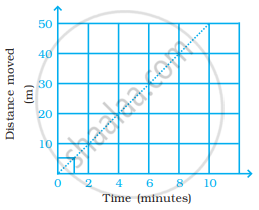
The graph given in figure is true for
Starting from A, Paheli moves along a rectangular path ABCD as shown in figure. She takes 2 minutes to travel each side. Plot a distance-time graph and explain whether the motion is uniform or non-uniform.

Assertion: The position-time graph of a uniform motion in one dimension of a body can have a negative slope
Reason: When the speed of the body decreases with time then, the position-time graph of the moving body has a negative slope.
