Advertisements
Advertisements
प्रश्न
Given figure shows the distance-time graph of three objects A, B and C. Study the graph and answer the following questions:
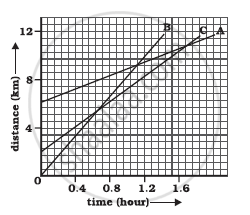
- Which of the three is travelling the fastest?
- Are all three ever at the same point on the road?
- How far has C travelled when B passes A?
- How far has B travelled by the time it passes C?
Advertisements
उत्तर
- The slope of B is greater than that of A and C. Hence, B is moving the fastest.
- No, because the three lines are not intersecting at any point.
- By the time B passes A, C covers a distance of about 9 km or more.
- By the time B passes C, it has travelled 6 km.
संबंधित प्रश्न
What is the nature of the distance-time graphs for uniform and non-uniform motion of an object?
The speed-time graph for a car is shown in the following figure:
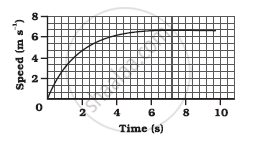
- Find how far the car travels in the first 4 seconds. Shade the area on the graph that represents the distance travelled by the car during the period.
- Which part of the graph represents uniform motion of the car?
Figure shows the distance-time graph for the motion of two vehicles A and B. Which one of them is moving faster?
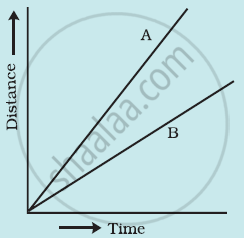
Figure: Distance-time graph for the motion of two cars
What conclusion can you draw about the speed of a body from the following distance-time graph ?
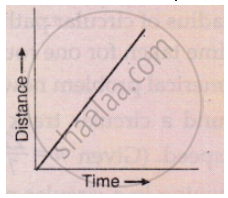
Name the two quantities, the slope of whose graph give speed .
A car is travelling at 20 m/s along a road. A child runs out into the road 50 m ahead and the car driver steps on the brake pedal. What must the car’s deceleration be if the car is to stop just before it reaches the child ?
The slope of the distance-time graph at any point gives______.
What are the uses of the graphical study of motion?
Complete the data of the table given below with the help of the distance-time graph given in the figure.
| Distance (m) | 0 | 4 | ? | 12 | ? | 20 |
| Time (s) | 0 | 2 | 4 | ? | 8 | 10 |

Boojho goes to the football ground to play football. The distance-time graph of his journey from his home to the ground is given in the figure.
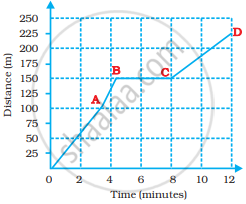
- What does the graph between points B and C indicate about the motion of Boojho?
- Is the motion between 0 to 4 minutes uniform or non-uniform?
- What is his speed between 8 and 12 minutes of his journey?
