Advertisements
Advertisements
प्रश्न
Given figure shows the distance-time graph of three objects A, B and C. Study the graph and answer the following questions:
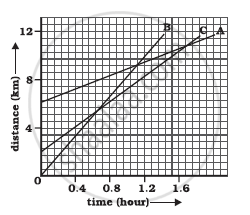
- Which of the three is travelling the fastest?
- Are all three ever at the same point on the road?
- How far has C travelled when B passes A?
- How far has B travelled by the time it passes C?
Advertisements
उत्तर
- The slope of B is greater than that of A and C. Hence, B is moving the fastest.
- No, because the three lines are not intersecting at any point.
- By the time B passes A, C covers a distance of about 9 km or more.
- By the time B passes C, it has travelled 6 km.
APPEARS IN
संबंधित प्रश्न
What can you say about the motion of an object if its speed-time graph is a straight line parallel to the time axis?
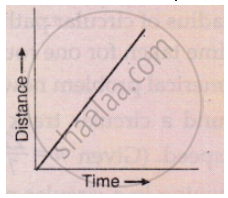
What conclusion can you draw about the speed of a body from the following distance-time graph ?
Fill in the following blank with suitable word :
The slope of a speed-time graph of a moving body gives its………………………..
Four cars A, B, C and D are moving on a levelled, straight road. Their distance-time graphs are shown in the given figure. Which of the following is the correct statement regarding the motion of these cars?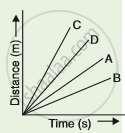
A student draws a distance-time graph for a moving scooter and finds that a section of the graph is horizontal line parallel to the time axis. Which of the following conclusion is correct about this section of the graph?
Figure (a) shows the displacement-time graph for the motion of a body. Use it to calculate the velocity of the body at t = 1 s, 2 s and 3 s, and then draw the velocity-time graph in Figure (b) for it.
 |
 |
| (a) | (b) |
Write down the type of motion of a body in each of the following distance time-graph.
Show the shape of the distance – time graph for the motion in the following cases.
- A bus moving with a constant speed.
- A car parked on a road side.
The slope of the distance-time graph at any point gives______.
Assertion: The slope of the distance-time graph of a body moving with high speed is steeper than the slope of the distance-time graph of a body with low velocity.
Reason: Slope of distance-time graph = speed of the body.
