Advertisements
Advertisements
प्रश्न
A student draws a distance-time graph for a moving scooter and finds that a section of the graph is horizontal line parallel to the time axis. Which of the following conclusion is correct about this section of the graph?
पर्याय
the scooter has uniform by scooter is the maximum in this section
the distance travelled by scooter is the maximum in this section
the distance travelled by scooter is the minimum in this section
the distance travelled by the scooter is zero in this section
Advertisements
उत्तर
If distance time graph is parallel to the time axis then the object has not travelled any distance. So, the answer is
(d) Distance travelled by the scooter is zero in this section.
APPEARS IN
संबंधित प्रश्न
What can you say about the motion of an object if its speed-time graph is a straight line parallel to the time axis?
Show the shape of the distance-time graph for the motion in the following case:
A car moving with a constant speed.
What conclusion can you draw about the speed of a body from the following distance-time graph ?
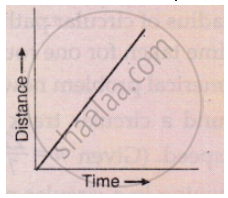
Name the two quantities, the slope of whose graph give speed .
Two friends leave Delhi for Chandigarh in their cars. A starts at 5 am and moves with a constant speed of 30 km/h, whereas B starts at 6 am and moves with a constant speed of 40 kmh-1. Plot the distance-time graph for their motion and find at what time the two friends will meet and at what distance from Delhi.
A body moves along a straight road with a speed of 20 m/s and has a uniform acceleration of 5 m/s2. What will be its speed after 2 s?
Write down the type of motion of a body in each of the following distance time-graph.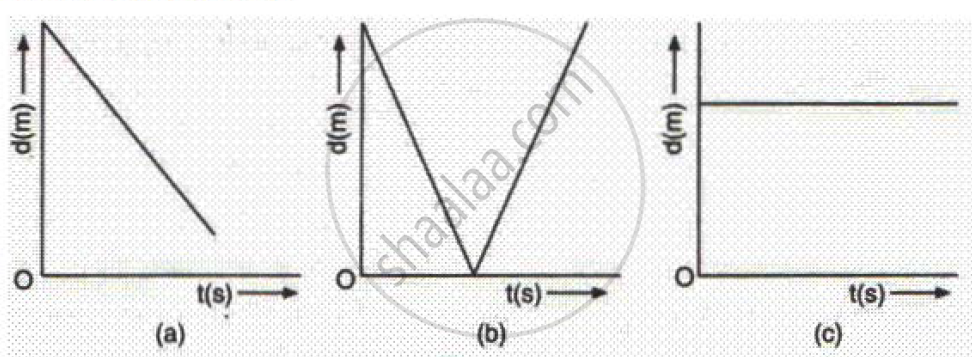
Boojho goes to the football ground to play football. The distance-time graph of his journey from his home to the ground is given in the figure.
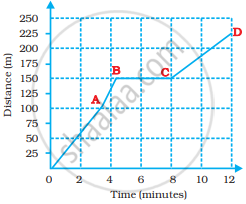
- What does the graph between points B and C indicate about the motion of Boojho?
- Is the motion between 0 to 4 minutes uniform or non-uniform?
- What is his speed between 8 and 12 minutes of his journey?
The area under velocity time graph represents ______.
What do you infer if
- Distance – time graph is a straight line.
- The velocity-time graph is curved.
- Displacement time is zigzag.
