Advertisements
Advertisements
प्रश्न
Boojho goes to the football ground to play football. The distance-time graph of his journey from his home to the ground is given in the figure.
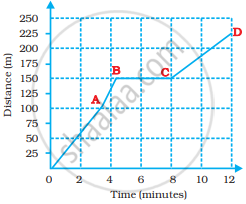
- What does the graph between points B and C indicate about the motion of Boojho?
- Is the motion between 0 to 4 minutes uniform or non-uniform?
- What is his speed between 8 and 12 minutes of his journey?
Advertisements
उत्तर
a. Graph between points B and C is a horizontal line which indicates that Boojho is at rest, i.e., his speed is zero.
b. Motion between 0 to 4 minutes is non-uniform as distance-time graph for this time interval is not a straight line.
c. Speed of Boojho between 8 and 12 minutes of his journey
= `((225 - 150) "m")/((12 - 8) "min")`
= `75/4`
= 18.75 m/min
APPEARS IN
संबंधित प्रश्न
The speed-time graph for a car is shown in the following figure:
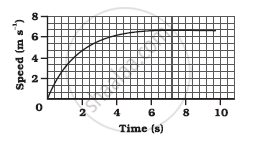
- Find how far the car travels in the first 4 seconds. Shade the area on the graph that represents the distance travelled by the car during the period.
- Which part of the graph represents uniform motion of the car?
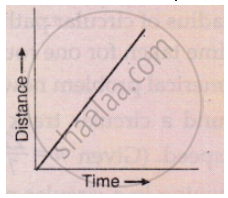
What conclusion can you draw about the speed of a body from the following distance-time graph ?
Fill in the following blank with suitable word :
The slope of a distance-time graph indicates ………………….. of a moving body.
Fill in the following blank with suitable word :
The slope of a speed-time graph of a moving body gives its………………………..
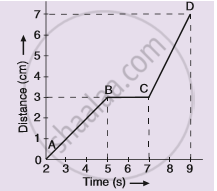
The graph given alongside shows the positions of a body at different times. Calculate the speed of the body as it moves from :
(1) A to B,
(2) B to C, and
(3) C to D.
A body moves along a straight road with a speed of 20 m/s and has a uniform acceleration of 5 m/s2. What will be its speed after 2 s?
Show the shape of the distance – time graph for the motion in the following cases.
- A bus moving with a constant speed.
- A car parked on a road side.
What are the uses of the graphical study of motion?
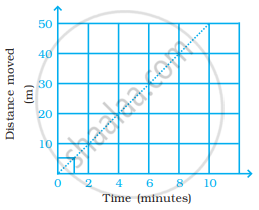
Two students were asked to plot a distance-time graph for the motion described by Table A and Table B.
| Table A |
||||||
| Distance moved (m) | 0 | 10 | 20 | 30 | 40 | 50 |
| Time (minutes) | 0 | 2 | 4 | 6 | 8 | 10 |
| Table B |
||||||
| Distance moved (m) | 0 | 5 | 10 | 15 | 20 | 25 |
| Time (minutes) | 0 | 1 | 2 | 3 | 4 | 5 |
The graph given in figure is true for
The area under velocity time graph represents ______.
