Advertisements
Advertisements
प्रश्न
A body moves along a straight road with a speed of 20 m/s and has a uniform acceleration of 5 m/s2. What will be its speed after 2 s?
Advertisements
उत्तर
Initial velocity u = 20 m/s.
Acceleration = 5 m/s2.
T = 2 s.
We know v= u + at.
v= 20 + 5X2= 30 m/s.
APPEARS IN
संबंधित प्रश्न
What can you say about the motion of an object whose distance-time graph is a straight line parallel to the time axis?
Given figure shows the distance-time graph of three objects A, B and C. Study the graph and answer the following questions:
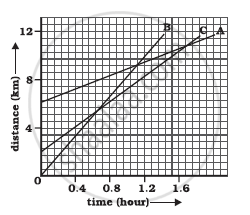
- Which of the three is travelling the fastest?
- Are all three ever at the same point on the road?
- How far has C travelled when B passes A?
- How far has B travelled by the time it passes C?
The speed-time graph for a car is shown in the following figure:
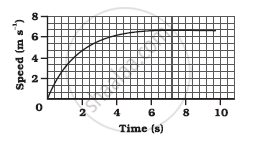
- Find how far the car travels in the first 4 seconds. Shade the area on the graph that represents the distance travelled by the car during the period.
- Which part of the graph represents uniform motion of the car?
Which of the following distance-time graphs shows a truck moving with speed which is not constant?
Fill in the following blank with suitable word :
The slope of a distance-time graph indicates ………………….. of a moving body.
Name the two quantities, the slope of whose graph give speed .
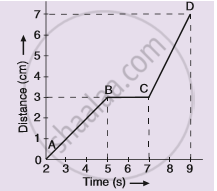
The graph given alongside shows the positions of a body at different times. Calculate the speed of the body as it moves from :
(1) A to B,
(2) B to C, and
(3) C to D.
Four cars A, B, C and D are moving on a levelled, straight road. Their distance-time graphs are shown in the given figure. Which of the following is the correct statement regarding the motion of these cars?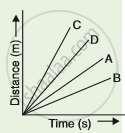
Write down the type of motion of a body in each of the following distance time-graph.
What are the uses of the graphical study of motion?
