Advertisements
Advertisements
प्रश्न
The speed-time graph for a car is shown in the following figure:
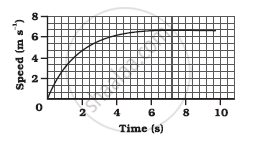
- Find how far the car travels in the first 4 seconds. Shade the area on the graph that represents the distance travelled by the car during the period.
- Which part of the graph represents uniform motion of the car?
Advertisements
उत्तर
The motion during the first 4 seconds is not uniformly accelerated. So, the distance travelled by car in the first 4 seconds is calculated using the graphical method.
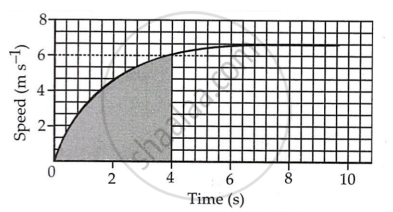
(a) Number of squares in the shaded part of the graph is 320.5
One small square m x-axis represents `t = 2/5 s`
One small square on the y-axis represents.
`v = 2/3 ms^-1`
∴ area of each square, `v xx t`
= `2/3 xx 2/5`
= `4/15 m`
Total area = `61.5 × 4/15`
= 16.4 m
(b) The limiting flat portion of the curve describes the constant speed of the car, i.e., a speed of 6.0 m s−1. At this stage, the acceleration of the car is zero.
Therefore, a portion of the graph between t = 6 s to 10 s, describes the uniform motion of the car.
APPEARS IN
संबंधित प्रश्न
Show the shape of the distance-time graph for the motion in the following case:
A car moving with a constant speed.
Figure shows the distance-time graph for the motion of two vehicles A and B. Which one of them is moving faster?
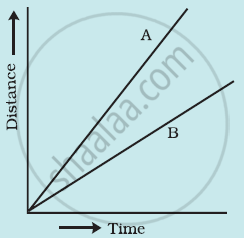
Figure: Distance-time graph for the motion of two cars
What does the slope of a distance-time graph indicate ?
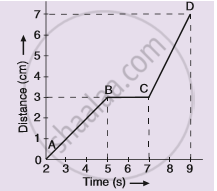
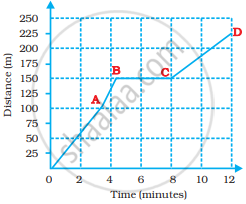
The graph given alongside shows the positions of a body at different times. Calculate the speed of the body as it moves from :
(1) A to B,
(2) B to C, and
(3) C to D.
A car is travelling at 20 m/s along a road. A child runs out into the road 50 m ahead and the car driver steps on the brake pedal. What must the car’s deceleration be if the car is to stop just before it reaches the child ?
Two friends leave Delhi for Chandigarh in their cars. A starts at 5 am and moves with a constant speed of 30 km/h, whereas B starts at 6 am and moves with a constant speed of 40 kmh-1. Plot the distance-time graph for their motion and find at what time the two friends will meet and at what distance from Delhi.
Write down the type of motion of a body in each of the following distance time-graph.
Show the shape of the distance – time graph for the motion in the following cases.
- A bus moving with a constant speed.
- A car parked on a road side.
What are the uses of the graphical study of motion?
Boojho goes to the football ground to play football. The distance-time graph of his journey from his home to the ground is given in the figure.
- What does the graph between points B and C indicate about the motion of Boojho?
- Is the motion between 0 to 4 minutes uniform or non-uniform?
- What is his speed between 8 and 12 minutes of his journey?
