Advertisements
Advertisements
Question
A student draws a distance-time graph for a moving scooter and finds that a section of the graph is horizontal line parallel to the time axis. Which of the following conclusion is correct about this section of the graph?
Options
the scooter has uniform by scooter is the maximum in this section
the distance travelled by scooter is the maximum in this section
the distance travelled by scooter is the minimum in this section
the distance travelled by the scooter is zero in this section
Advertisements
Solution
If distance time graph is parallel to the time axis then the object has not travelled any distance. So, the answer is
(d) Distance travelled by the scooter is zero in this section.
APPEARS IN
RELATED QUESTIONS
What can you say about the motion of an object if its speed-time graph is a straight line parallel to the time axis?
Show the shape of the distance-time graph for the motion in the following case:
A car moving with a constant speed.
What does the slope of a distance-time graph indicate ?
Name the two quantities, the slope of whose graph give speed .
The graph given alongside shows the positions of a body at different times. Calculate the speed of the body as it moves from :
(1) A to B,
(2) B to C, and
(3) C to D.
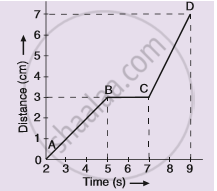
A body moves along a straight road with a speed of 20 m/s and has a uniform acceleration of 5 m/s2. What will be its speed after 2 s?
What are the uses of the graphical study of motion?
The slope of the distance-time curve is steeper/greater is the ______.
Assertion: The position-time graph of a uniform motion in one dimension of a body can have a negative slope
Reason: When the speed of the body decreases with time then, the position-time graph of the moving body has a negative slope.
Assertion: The slope of the distance-time graph of a body moving with high speed is steeper than the slope of the distance-time graph of a body with low velocity.
Reason: Slope of distance-time graph = speed of the body.
