Advertisements
Advertisements
Question
Show the shape of the distance-time graph for the motion in the following case:
A car moving with a constant speed.
Advertisements
Solution
A car moving with a constant speed covers an equal distance in equal intervals of time.
Such motion of the car is represented in the given distance-time graph.

APPEARS IN
RELATED QUESTIONS
What does the slope of a distance-time graph indicate ?
Fill in the following blank with suitable word :
The slope of a distance-time graph indicates ………………….. of a moving body.
Figure (a) shows the displacement-time graph for the motion of a body. Use it to calculate the velocity of the body at t = 1 s, 2 s and 3 s, and then draw the velocity-time graph in Figure (b) for it.
 |
 |
| (a) | (b) |
A spaceship is moving in space with a velocity of 60 kms−1. It fires its retro engines for 20 seconds and velocity is reduced to 55 kms−1. Calculate the distance travelled by a spaceship in 40 s, from the time of firing of the retro- rockets.
Write down the type of motion of a body in each of the following distance time-graph.
Show the shape of the distance – time graph for the motion in the following cases.
- A bus moving with a constant speed.
- A car parked on a road side.
What are the uses of the graphical study of motion?
Boojho goes to the football ground to play football. The distance-time graph of his journey from his home to the ground is given in the figure.
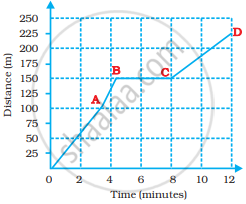
- What does the graph between points B and C indicate about the motion of Boojho?
- Is the motion between 0 to 4 minutes uniform or non-uniform?
- What is his speed between 8 and 12 minutes of his journey?
The area under velocity time graph represents ______.
The slope of the distance-time graph indicates the speed.
