Advertisements
Advertisements
Question
A spaceship is moving in space with a velocity of 60 kms−1. It fires its retro engines for 20 seconds and velocity is reduced to 55 kms−1. Calculate the distance travelled by a spaceship in 40 s, from the time of firing of the retro- rockets.
Advertisements
Solution
Initial velocity of spaceship = u = 60 kms−1
Final velocity of spaceship = v = 55 kms−1
It decelerates for 20 s
t = 20 s
v = u + at
55 = 60 + a (20)
20a = 55 – 60
20a = −5
a = `(-5)/20`
a = − 0.25
distance travelled in the first 20 sec. = s = u × t − `1/2` a × t2
s = 60 × 20 − `1/2` × 0.25 × 202
= 1200 − `1/2` × 0.25 × 400
= 1200 − `1/2` × 100
= 1200 − 50
= 1,150 km.
After 20 sec. the velocity of the spaceship is constant at 55 km/sec. Hence, the distance travelled is = 55 × 20 = 1,100 km
The total distance travelled in 40 sec. = 1,150 + 1,100 = 2,250 km
APPEARS IN
RELATED QUESTIONS
What can you say about the motion of an object whose distance-time graph is a straight line parallel to the time axis?
Figure shows the distance-time graph for the motion of two vehicles A and B. Which one of them is moving faster?
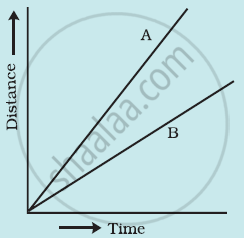
Figure: Distance-time graph for the motion of two cars
What can you say about the motion of a body whose distance-time graph is a straight line parallel to the time axis ?
A cyclist is travelling at 15 m s-1. She applies brakes so that she does not collide with a wall 18 m away. What deceleration must she have ?
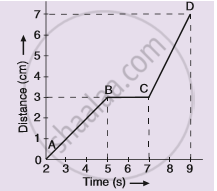
The graph given alongside shows the positions of a body at different times. Calculate the speed of the body as it moves from :
(1) A to B,
(2) B to C, and
(3) C to D.
If we denote speed by S, distance by D and time by T, the relationship between these quantities is ______.
Complete the data of the table given below with the help of the distance-time graph given in the figure.
| Distance (m) | 0 | 4 | ? | 12 | ? | 20 |
| Time (s) | 0 | 2 | 4 | ? | 8 | 10 |

Boojho goes to the football ground to play football. The distance-time graph of his journey from his home to the ground is given in the figure.
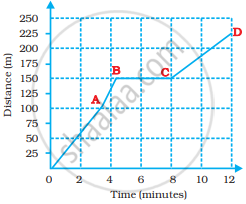
- What does the graph between points B and C indicate about the motion of Boojho?
- Is the motion between 0 to 4 minutes uniform or non-uniform?
- What is his speed between 8 and 12 minutes of his journey?
Assertion: The slope of the distance-time graph of a body moving with high speed is steeper than the slope of the distance-time graph of a body with low velocity.
Reason: Slope of distance-time graph = speed of the body.
What do you infer if
- Distance – time graph is a straight line.
- The velocity-time graph is curved.
- Displacement time is zigzag.
