Advertisements
Advertisements
Question
Given figure shows the distance-time graph of three objects A, B and C. Study the graph and answer the following questions:
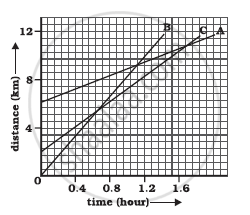
- Which of the three is travelling the fastest?
- Are all three ever at the same point on the road?
- How far has C travelled when B passes A?
- How far has B travelled by the time it passes C?
Advertisements
Solution
- The slope of B is greater than that of A and C. Hence, B is moving the fastest.
- No, because the three lines are not intersecting at any point.
- By the time B passes A, C covers a distance of about 9 km or more.
- By the time B passes C, it has travelled 6 km.
APPEARS IN
RELATED QUESTIONS
What is the nature of the distance-time graphs for uniform and non-uniform motion of an object?
What can you say about the motion of an object if its speed-time graph is a straight line parallel to the time axis?
Figure shows the distance-time graph for the motion of two vehicles A and B. Which one of them is moving faster?
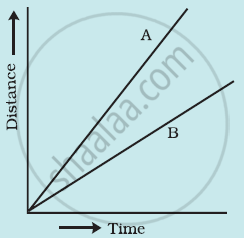
Figure: Distance-time graph for the motion of two cars
What does the slope of a distance-time graph indicate ?
What can you say about the motion of a body whose distance-time graph is a straight line parallel to the time axis ?
Name the two quantities, the slope of whose graph give speed .
A car is travelling at 20 m/s along a road. A child runs out into the road 50 m ahead and the car driver steps on the brake pedal. What must the car’s deceleration be if the car is to stop just before it reaches the child ?
Write down the type of motion of a body in each of the following distance time-graph.
The slope of the distance-time curve is steeper/greater is the ______.
Assertion: The slope of the distance-time graph of a body moving with high speed is steeper than the slope of the distance-time graph of a body with low velocity.
Reason: Slope of distance-time graph = speed of the body.
