Advertisements
Advertisements
प्रश्न
A spaceship is moving in space with a velocity of 60 kms−1. It fires its retro engines for 20 seconds and velocity is reduced to 55 kms−1. Calculate the distance travelled by a spaceship in 40 s, from the time of firing of the retro- rockets.
Advertisements
उत्तर
Initial velocity of spaceship = u = 60 kms−1
Final velocity of spaceship = v = 55 kms−1
It decelerates for 20 s
t = 20 s
v = u + at
55 = 60 + a (20)
20a = 55 – 60
20a = −5
a = `(-5)/20`
a = − 0.25
distance travelled in the first 20 sec. = s = u × t − `1/2` a × t2
s = 60 × 20 − `1/2` × 0.25 × 202
= 1200 − `1/2` × 0.25 × 400
= 1200 − `1/2` × 100
= 1200 − 50
= 1,150 km.
After 20 sec. the velocity of the spaceship is constant at 55 km/sec. Hence, the distance travelled is = 55 × 20 = 1,100 km
The total distance travelled in 40 sec. = 1,150 + 1,100 = 2,250 km
APPEARS IN
संबंधित प्रश्न
What is the nature of the distance-time graphs for uniform and non-uniform motion of an object?
Show the shape of the distance-time graph for the motion in the following case:
A car moving with a constant speed.
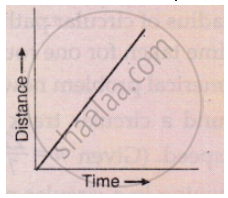
What conclusion can you draw about the speed of a body from the following distance-time graph ?
Fill in the following blank with suitable word :
The slope of a speed-time graph of a moving body gives its………………………..
A student draws a distance-time graph for a moving scooter and finds that a section of the graph is horizontal line parallel to the time axis. Which of the following conclusion is correct about this section of the graph?
Figure (a) shows the displacement-time graph for the motion of a body. Use it to calculate the velocity of the body at t = 1 s, 2 s and 3 s, and then draw the velocity-time graph in Figure (b) for it.
 |
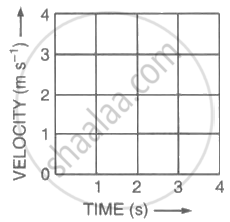 |
| (a) | (b) |
Two students were asked to plot a distance-time graph for the motion described by Table A and Table B.
| Table A |
||||||
| Distance moved (m) | 0 | 10 | 20 | 30 | 40 | 50 |
| Time (minutes) | 0 | 2 | 4 | 6 | 8 | 10 |
| Table B |
||||||
| Distance moved (m) | 0 | 5 | 10 | 15 | 20 | 25 |
| Time (minutes) | 0 | 1 | 2 | 3 | 4 | 5 |
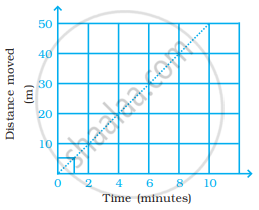
The graph given in figure is true for
If we denote speed by S, distance by D and time by T, the relationship between these quantities is ______.
Distance between Bholu’s and Golu’s house is 9 km. Bholu has to attend Golu’s birthday party at 7 o’clock. He started from his home at 6 o’clock on his bicycle and covered a distance of 6 km in 40 minutes. At that point, he met Chintu and he spoke to him for 5 minutes and reached Golu’s birthday party at 7 o’clock. With what speed did he cover the second part of the journey? Calculate his average speed for the entire journey.
The area under velocity time graph represents ______.
