Advertisements
Advertisements
Question
Write down the type of motion of a body in each of the following distance time-graph.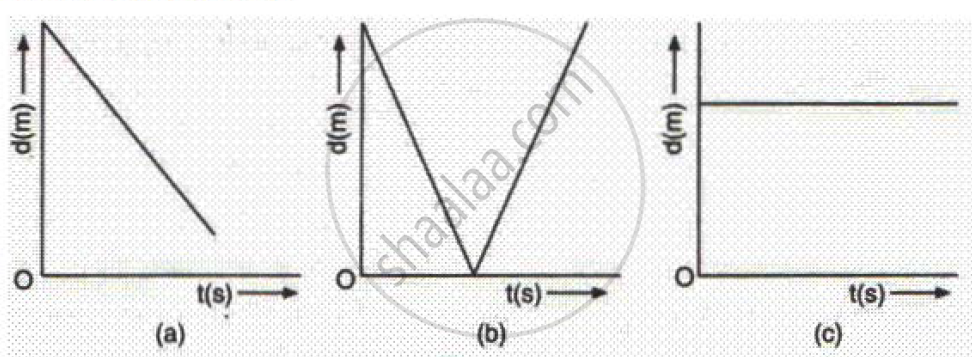
Advertisements
Solution

(i) The body is showing decreasing velocity that is retardation.
(ii) Initially, the body is showing retarded motion and then an accelerating one.
(iii) The body is in the state of rest.
APPEARS IN
RELATED QUESTIONS
What can you say about the motion of an object whose distance-time graph is a straight line parallel to the time axis?
What can you say about the motion of an object if its speed-time graph is a straight line parallel to the time axis?
Show the shape of the distance-time graph for the motion in the following case:
A car parked on a side road.
What does the slope of a distance-time graph indicate ?
What can you say about the motion of a body whose distance-time graph is a straight line parallel to the time axis ?
Fill in the following blank with suitable word :
The slope of a speed-time graph of a moving body gives its………………………..
Four cars A, B, C and D are moving on a levelled, straight road. Their distance-time graphs are shown in the given figure. Which of the following is the correct statement regarding the motion of these cars?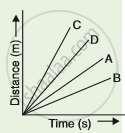
Complete the data of the table given below with the help of the distance-time graph given in the figure.
| Distance (m) | 0 | 4 | ? | 12 | ? | 20 |
| Time (s) | 0 | 2 | 4 | ? | 8 | 10 |

The area under velocity time graph represents ______.
The slope of the distance-time curve is steeper/greater is the ______.
