Advertisements
Advertisements
Question
Complete the data of the table given below with the help of the distance-time graph given in the figure.
| Distance (m) | 0 | 4 | ? | 12 | ? | 20 |
| Time (s) | 0 | 2 | 4 | ? | 8 | 10 |

Advertisements
Solution
| Distance (m) | 0 | 4 | 8 | 12 | 16 | 20 |
| Time (s) | 0 | 2 | 4 | 6 | 8 | 10 |
APPEARS IN
RELATED QUESTIONS
The speed-time graph for a car is shown in the following figure:
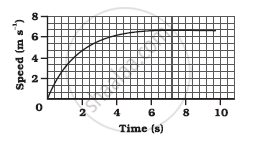
- Find how far the car travels in the first 4 seconds. Shade the area on the graph that represents the distance travelled by the car during the period.
- Which part of the graph represents uniform motion of the car?
Show the shape of the distance-time graph for the motion in the following case:
A car parked on a side road.
Which of the following distance-time graphs shows a truck moving with speed which is not constant?
What does the slope of a distance-time graph indicate ?
Fill in the following blank with suitable word :
The slope of a distance-time graph indicates ………………….. of a moving body.
A student draws a distance-time graph for a moving scooter and finds that a section of the graph is horizontal line parallel to the time axis. Which of the following conclusion is correct about this section of the graph?
Two students were asked to plot a distance-time graph for the motion described by Table A and Table B.
| Table A |
||||||
| Distance moved (m) | 0 | 10 | 20 | 30 | 40 | 50 |
| Time (minutes) | 0 | 2 | 4 | 6 | 8 | 10 |
| Table B |
||||||
| Distance moved (m) | 0 | 5 | 10 | 15 | 20 | 25 |
| Time (minutes) | 0 | 1 | 2 | 3 | 4 | 5 |
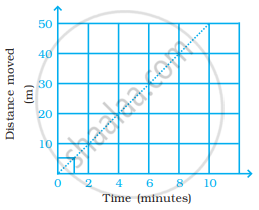
The graph given in figure is true for
If we denote speed by S, distance by D and time by T, the relationship between these quantities is ______.
Distance between Bholu’s and Golu’s house is 9 km. Bholu has to attend Golu’s birthday party at 7 o’clock. He started from his home at 6 o’clock on his bicycle and covered a distance of 6 km in 40 minutes. At that point, he met Chintu and he spoke to him for 5 minutes and reached Golu’s birthday party at 7 o’clock. With what speed did he cover the second part of the journey? Calculate his average speed for the entire journey.
What do you infer if
- Distance – time graph is a straight line.
- The velocity-time graph is curved.
- Displacement time is zigzag.
