Advertisements
Advertisements
Question
The figure represents graphically the velocity of a car moving along a straight road over a period of 100 hours.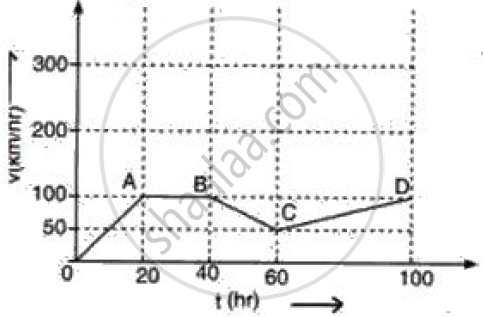
Calculate the distance travelled in the last 40 h.
Advertisements
Solution
Distance travelled in last 40 hour would be equal to area under graph during that time = 50 x (100 - 60) + `1/2`x(100 - 60) x(100 - 50).
S = 2000 + 1000 = 3000 km.
APPEARS IN
RELATED QUESTIONS
Under what conditions can a body travel a certain distance and yet its resultant displacement be zero ?
What is the difference between distance travelled by a body and its displacement ? Explain with the
help of a diagram.
If on a round trip you travel 6 km and then arrive back home :
What is your final displacement ?
A particle is moving in a circular path of radius r. The displacement after half a circle would be :
Differentiate between distance and displacement.
What information about the motion of a body are obtained from the displacement-time graph?
Calculate the distance and displacement in the following case:
A body is moving along a circular path of radius r. What will be the distance and displacement of the body when it completes:
Half a revolution
Ashok starts from his house and travels 3 km to reach his school. On finding the school gates closed, he returns to his house. What is?
The distance traveled by Ashok.
A man leaves his house at 6.30 a.m. for a morning walk and returns back at 7.30 a.m. after covering 4 km. The Displacement covered by him is ______.
