Advertisements
Advertisements
Question
Figure represents graphically the velocity of a car moving along a straight road over a period of 100 hours.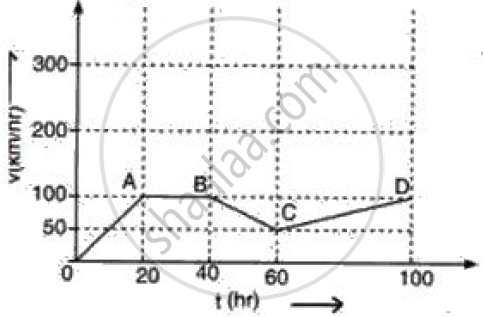
Calculate the acceleration along AB and the retardation along BC.
Advertisements
Solution
Acceleration along AB= (100 - 100)/(40 -20) = 0 ms-2
Retardation along CD= (100 - 50)/ (100 - 60) = 50/40 = 1.25 ms-2
APPEARS IN
RELATED QUESTIONS
Give a scientific reason.
When an object falls freely to the ground, its acceleration is uniform.
A bullet initially moving with a velocity 20 m/s strikes a target and comes to rest after penetrating a distance 10 cm into the target. Calculate the retardation caused by the target.
A train moving with a velocity of 20 ms−1 is brought to rest by applying brakes in 5 s. Calculate the retardation.
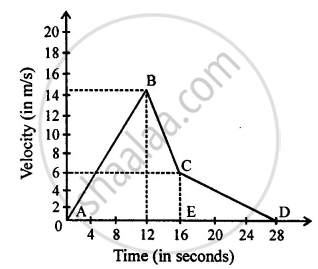
From the velocity – time graph given below, calculate deceleration in region BC.
State if the following situation is possible:
A body moving with a constant velocity in an accelerated motion.
Is it possible for an accelerating body to have constant speed?
Acceleration is defined as the rate of change of ______.
A car is being driven at a speed of 20ms-1 when brakes are applied to bring it to rest in 5 s. The deceleration produced in this case will be ______.
Assertion: A positive acceleration of a body can be associated with the slowing down of the body.
Reason: Acceleration is a vector.
When a body is said to be in
- uniform acceleration
- non–uniform acceleration?
