Advertisements
Advertisements
Question
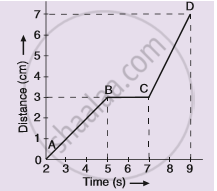
The graph given alongside shows the positions of a body at different times. Calculate the speed of the body as it moves from :
(1) A to B,
(2) B to C, and
(3) C to D.
Advertisements
Solution
(i) The distance covered from A to B,
= 3 – 0
= 3 cm
Time taken to cover the distance from A to B
= 5 – 2
= 3 s
Hence speed,
= `"Distance"/"Time"`
= `3/3` cm/s
= 1 cm/s
(ii) The speed of the body as it moves from B to C is zero because the distance travelled is zero.
(iii) The distance covered from C to D,
= 7 – 3
= 4 cm
Time taken to cover the distance from C to D,
= 9 – 7
= 2 s
Hence speed,
= `"Distance"/"Time"`
= `4/2` cm/s
= 2 cm/s
APPEARS IN
RELATED QUESTIONS
What can you say about the motion of an object if its speed-time graph is a straight line parallel to the time axis?
Show the shape of the distance-time graph for the motion in the following case:
A car moving with a constant speed.
Which of the following distance-time graphs shows a truck moving with speed which is not constant?
What can you say about the motion of a body whose distance-time graph is a straight line parallel to the time axis ?
A car is travelling at 20 m/s along a road. A child runs out into the road 50 m ahead and the car driver steps on the brake pedal. What must the car’s deceleration be if the car is to stop just before it reaches the child ?
Four cars A, B, C and D are moving on a levelled, straight road. Their distance-time graphs are shown in the given figure. Which of the following is the correct statement regarding the motion of these cars?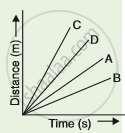
Figure (a) shows the displacement-time graph for the motion of a body. Use it to calculate the velocity of the body at t = 1 s, 2 s and 3 s, and then draw the velocity-time graph in Figure (b) for it.
 |
 |
| (a) | (b) |
Two friends leave Delhi for Chandigarh in their cars. A starts at 5 am and moves with a constant speed of 30 km/h, whereas B starts at 6 am and moves with a constant speed of 40 kmh-1. Plot the distance-time graph for their motion and find at what time the two friends will meet and at what distance from Delhi.
The area under velocity time graph represents ______.
The slope of the distance-time graph indicates the speed.
