Advertisements
Advertisements
प्रश्न
The slope of the distance-time graph at any point gives______.
Advertisements
उत्तर
The slope of the distance-time graph at any point gives speed
APPEARS IN
संबंधित प्रश्न
Given figure shows the distance-time graph of three objects A, B and C. Study the graph and answer the following questions:
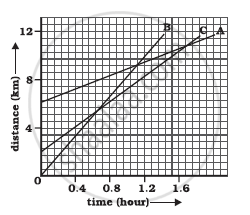
- Which of the three is travelling the fastest?
- Are all three ever at the same point on the road?
- How far has C travelled when B passes A?
- How far has B travelled by the time it passes C?
The speed-time graph for a car is shown in the following figure:
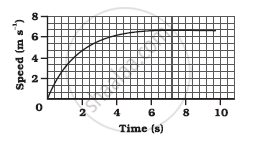
- Find how far the car travels in the first 4 seconds. Shade the area on the graph that represents the distance travelled by the car during the period.
- Which part of the graph represents uniform motion of the car?
Show the shape of the distance-time graph for the motion in the following case:
A car moving with a constant speed.
Show the shape of the distance-time graph for the motion in the following case:
A car parked on a side road.
Fill in the following blank with suitable word :
The slope of a distance-time graph indicates ………………….. of a moving body.
Name the two quantities, the slope of whose graph give speed .
If we denote speed by S, distance by D and time by T, the relationship between these quantities is ______.
The area under velocity time graph represents ______.
The slope of the distance-time curve is steeper/greater is the ______.
Assertion: The position-time graph of a uniform motion in one dimension of a body can have a negative slope
Reason: When the speed of the body decreases with time then, the position-time graph of the moving body has a negative slope.
