Advertisements
Advertisements
प्रश्न
A driver of a car travelling at 52 km h−1 applies the brakes and accelerates uniformly in the opposite direction. The car stops in 5 s. Another driver going at 3 km h−1 in another car applies his brakes slowly and stops in 10 s. On the same graph paper, plot the speed versus time graphs for the two cars. Which of the two cars travelled farther after the brakes were applied?
Advertisements
उत्तर
The data given in this numerical problem are in different units. So, we should first convert km h-1 unit into m s-1 unit.
For first car:
Initial velocity u = 52 km h-1
= `(52 "km")/(1 "h")`
= `(52 xx 1000 "m")/(1 xx 3600 "s")`
= 14.4 s-1
Final velocity, v = 0 km h-1 = 0.0 m s-1
Time taken, t = 5s
For second car:
Initial velocity, u = 3 km h-1
= `(3 "km")/(1"h")`
= `(3 xx 1000 "m")/(1 xx 3600 "s")`
= 0.8 ms-1
Final velocity, v = 0 km h-1 = 0.0 m s-1
Time taken, t = 10s
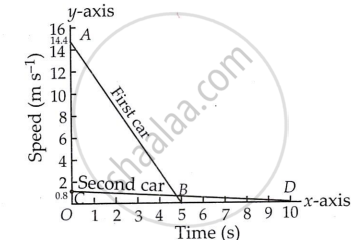
The area under a moving body's speed-time graph indicates the distance it has traveled.
So, Distance travelled by the first car = Area of the triangle AOB
= `1/2 xx "OB" xx "AO"`
= `1/2 xx 14.4` ms-1 × 5s
= `1/2 xx 14.4 xx 5 "m"`
= 36 m
Similarly, distance travelled by the second car = area of triangle COD.
= `1/2 xx "OD" xx "CO"`
= `1/2 xx 0.83 m s^-1 xx 10 s`
= `1/2 xx 0.83 xx 10 "m"`
= 4.1 m
Thus, the second car travels 4.1 m and the first car travels 36 m before coming to rest.
So, the first car travelled farther after the brakes were applied.
APPEARS IN
संबंधित प्रश्न
What can you say about the motion of an object whose distance-time graph is a straight line parallel to the time axis?
Given figure shows the distance-time graph of three objects A, B and C. Study the graph and answer the following questions:
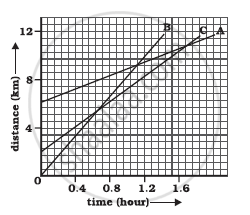
- Which of the three is travelling the fastest?
- Are all three ever at the same point on the road?
- How far has C travelled when B passes A?
- How far has B travelled by the time it passes C?
A car is travelling at 20 m/s along a road. A child runs out into the road 50 m ahead and the car driver steps on the brake pedal. What must the car’s deceleration be if the car is to stop just before it reaches the child ?
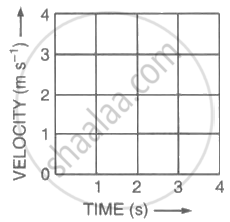
Figure (a) shows the displacement-time graph for the motion of a body. Use it to calculate the velocity of the body at t = 1 s, 2 s and 3 s, and then draw the velocity-time graph in Figure (b) for it.
 |
 |
| (a) | (b) |
A spaceship is moving in space with a velocity of 60 kms−1. It fires its retro engines for 20 seconds and velocity is reduced to 55 kms−1. Calculate the distance travelled by a spaceship in 40 s, from the time of firing of the retro- rockets.
The slope of the distance-time graph at any point gives______.
Two students were asked to plot a distance-time graph for the motion described by Table A and Table B.
| Table A |
||||||
| Distance moved (m) | 0 | 10 | 20 | 30 | 40 | 50 |
| Time (minutes) | 0 | 2 | 4 | 6 | 8 | 10 |
| Table B |
||||||
| Distance moved (m) | 0 | 5 | 10 | 15 | 20 | 25 |
| Time (minutes) | 0 | 1 | 2 | 3 | 4 | 5 |
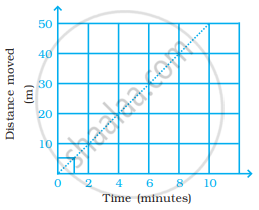
The graph given in figure is true for
If we denote speed by S, distance by D and time by T, the relationship between these quantities is ______.
Distance between Bholu’s and Golu’s house is 9 km. Bholu has to attend Golu’s birthday party at 7 o’clock. He started from his home at 6 o’clock on his bicycle and covered a distance of 6 km in 40 minutes. At that point, he met Chintu and he spoke to him for 5 minutes and reached Golu’s birthday party at 7 o’clock. With what speed did he cover the second part of the journey? Calculate his average speed for the entire journey.
Boojho goes to the football ground to play football. The distance-time graph of his journey from his home to the ground is given in the figure.
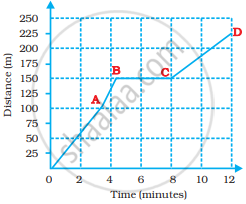
- What does the graph between points B and C indicate about the motion of Boojho?
- Is the motion between 0 to 4 minutes uniform or non-uniform?
- What is his speed between 8 and 12 minutes of his journey?
