Advertisements
Advertisements
प्रश्न
A car is travelling at 20 m/s along a road. A child runs out into the road 50 m ahead and the car driver steps on the brake pedal. What must the car’s deceleration be if the car is to stop just before it reaches the child ?
Advertisements
उत्तर
We have to find the deceleration. We have the following information given,
Initial velocity, (u) = 20 m/s
Final velocity, (v) = 0 m/s
Distance travelled, (s) = 50 m
Let the deceleration for the entire journey be (a)
We can calculate acceleration by using the 3rd equation of motion,
`a = (v^2-u^2)/(2s)`
(s) - Displacement
(u) - Initial velocity
(a) - Acceleration
(v) - Final velocity
Put the values in above equation to find the deceleration,
`a = [(0-400)/(2(50)]] "m/s"^2`
= `(-400/100)` `"m/s"^2`
= -4 `"m/s"^2`
Hence, deceleration is 4 m/s2.
APPEARS IN
संबंधित प्रश्न
What can you say about the motion of an object whose distance-time graph is a straight line parallel to the time axis?
Figure shows the distance-time graph for the motion of two vehicles A and B. Which one of them is moving faster?
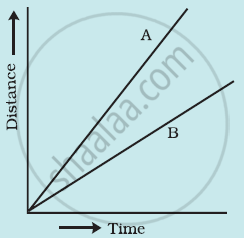
Figure: Distance-time graph for the motion of two cars
What does the slope of a distance-time graph indicate ?
Fill in the following blank with suitable word :
The slope of a distance-time graph indicates ………………….. of a moving body.
Fill in the following blank with suitable word :
The slope of a speed-time graph of a moving body gives its………………………..
Figure (a) shows the displacement-time graph for the motion of a body. Use it to calculate the velocity of the body at t = 1 s, 2 s and 3 s, and then draw the velocity-time graph in Figure (b) for it.
 |
 |
| (a) | (b) |
Write down the type of motion of a body in each of the following distance time-graph.
The slope of the distance-time graph at any point gives______.
The slope of the distance-time curve is steeper/greater is the ______.
Assertion: The slope of the distance-time graph of a body moving with high speed is steeper than the slope of the distance-time graph of a body with low velocity.
Reason: Slope of distance-time graph = speed of the body.
