Advertisements
Advertisements
प्रश्न
What does the slope of a distance-time graph indicate ?
Advertisements
उत्तर
APPEARS IN
संबंधित प्रश्न
What can you say about the motion of an object if its speed-time graph is a straight line parallel to the time axis?
A driver of a car travelling at 52 km h−1 applies the brakes and accelerates uniformly in the opposite direction. The car stops in 5 s. Another driver going at 3 km h−1 in another car applies his brakes slowly and stops in 10 s. On the same graph paper, plot the speed versus time graphs for the two cars. Which of the two cars travelled farther after the brakes were applied?
The speed-time graph for a car is shown in the following figure:
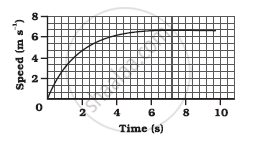
- Find how far the car travels in the first 4 seconds. Shade the area on the graph that represents the distance travelled by the car during the period.
- Which part of the graph represents uniform motion of the car?
Figure (a) shows the displacement-time graph for the motion of a body. Use it to calculate the velocity of the body at t = 1 s, 2 s and 3 s, and then draw the velocity-time graph in Figure (b) for it.
 |
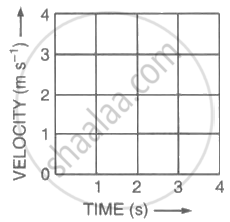 |
| (a) | (b) |
Write down the type of motion of a body in each of the following distance time-graph.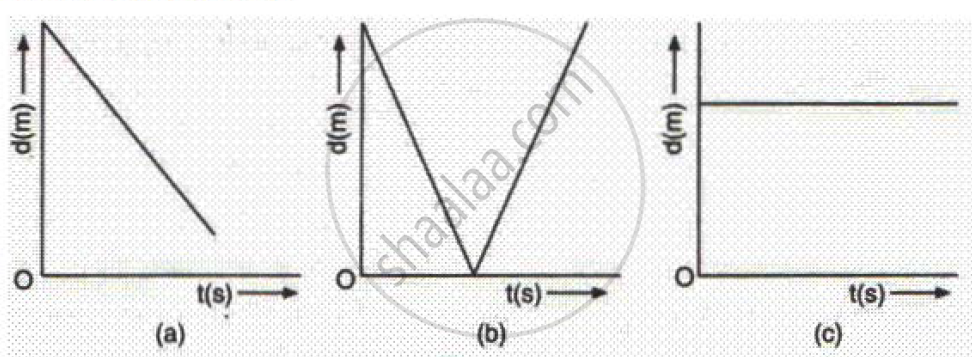
What are the uses of the graphical study of motion?
Two students were asked to plot a distance-time graph for the motion described by Table A and Table B.
| Table A |
||||||
| Distance moved (m) | 0 | 10 | 20 | 30 | 40 | 50 |
| Time (minutes) | 0 | 2 | 4 | 6 | 8 | 10 |
| Table B |
||||||
| Distance moved (m) | 0 | 5 | 10 | 15 | 20 | 25 |
| Time (minutes) | 0 | 1 | 2 | 3 | 4 | 5 |
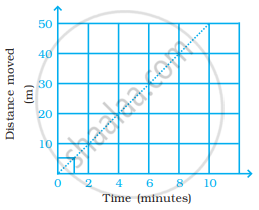
The graph given in figure is true for
If we denote speed by S, distance by D and time by T, the relationship between these quantities is ______.
Boojho goes to the football ground to play football. The distance-time graph of his journey from his home to the ground is given in the figure.
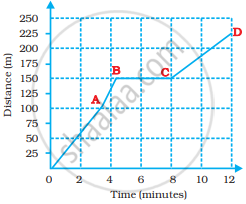
- What does the graph between points B and C indicate about the motion of Boojho?
- Is the motion between 0 to 4 minutes uniform or non-uniform?
- What is his speed between 8 and 12 minutes of his journey?
The slope of the distance-time graph indicates the speed.
