Advertisements
Advertisements
प्रश्न
Starting from A, Paheli moves along a rectangular path ABCD as shown in figure. She takes 2 minutes to travel each side. Plot a distance-time graph and explain whether the motion is uniform or non-uniform.

Advertisements
उत्तर
Since the distance covered per unit time for the entire rectangular path covered is not the same, the motion is non-uniform.

APPEARS IN
संबंधित प्रश्न
What can you say about the motion of an object whose distance-time graph is a straight line parallel to the time axis?
What can you say about the motion of an object if its speed-time graph is a straight line parallel to the time axis?
What can you say about the motion of a body whose distance-time graph is a straight line parallel to the time axis ?
Name the two quantities, the slope of whose graph give speed .
A student draws a distance-time graph for a moving scooter and finds that a section of the graph is horizontal line parallel to the time axis. Which of the following conclusion is correct about this section of the graph?
Figure (a) shows the displacement-time graph for the motion of a body. Use it to calculate the velocity of the body at t = 1 s, 2 s and 3 s, and then draw the velocity-time graph in Figure (b) for it.
 |
 |
| (a) | (b) |
Write down the type of motion of a body in each of the following distance time-graph.
Show the shape of the distance – time graph for the motion in the following cases.
- A bus moving with a constant speed.
- A car parked on a road side.
Complete the data of the table given below with the help of the distance-time graph given in the figure.
| Distance (m) | 0 | 4 | ? | 12 | ? | 20 |
| Time (s) | 0 | 2 | 4 | ? | 8 | 10 |

Boojho goes to the football ground to play football. The distance-time graph of his journey from his home to the ground is given in the figure.
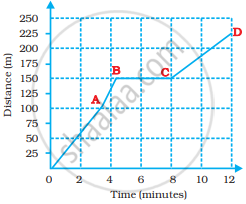
- What does the graph between points B and C indicate about the motion of Boojho?
- Is the motion between 0 to 4 minutes uniform or non-uniform?
- What is his speed between 8 and 12 minutes of his journey?
