Advertisements
Advertisements
Question
Draw a velocity-time graph for the free fall of a body under gravity starting from rest. Take g = 10m s-2
Advertisements
Solution
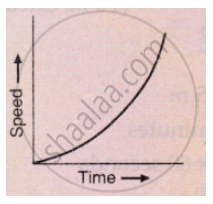
Below is the velocity-time graph for the free fall of a body under gravity, starting from rest:

APPEARS IN
RELATED QUESTIONS
What conclusion can you draw about the acceleration of a body from the speed-time graph shown below .
Fill in the following blank with suitable word :
In a speed-time graph, the area enclosed by the speed-time curve and the time axis gives the…………….. by the body.
Draw a velocity-time graph to show the following motion :
A car accelerates uniformly from rest for 5 s ; then it travels at a steady’ velocity for 5 s.
The velocity-time graph for part of a train journey is a horizontal straight line. What does this tell you about its acceleration ?
Diagram shows a velocity – time graph for a car starting from rest. The graph has three sections AB, BC, and CD.

Is the magnitude of acceleration higher or lower than that of retardation? Give a reason.
A body at rest is thrown downward from the top of the tower. Draw a distance – time graph of its free fall under gravity during the first 3 seconds. Show your table of values starting t = 0 with an interval of 1 second, (g = 10 ms−2).
The graph of one quantity versus another result in a straight line. How are the quantities related to each other?
Interpret the following graph:
Draw velocity-time graph to show:
Acceleration
Write a sentence to explain the shape of graph.
The velocity-displacement graph describing the motion of a bicycle is shown in the figure.

The acceleration-displacement graph of the bicycle's motion is best described by:
