Advertisements
Advertisements
Question
Draw a graph for acceleration against time for a uniformly accelerated motion. How can it be used to find the change in speed in a certain interval of time?
Advertisements
Solution

The area enclosed between the straight line and time axis for each interval of time gives the value of change in speed in that interval of time.
APPEARS IN
RELATED QUESTIONS
Give one example of the following motion:
Uniform retardation
A train starts from rest and accelerates uniformly at a rate of 2 m s−2 for 10 s. It then maintains a constant speed for 200 s. The brakes are then applied and the train is uniformly retarded and comes to rest in 50 s. Find
- The maximum velocity reached,
- The retardation in the last 50 s,
- The total distance travelled,
- The average velocity of the train.
Give an example of an accelerated body, moving with a uniform speed.
From the velocity – time graph given below, calculate deceleration in region BC.

A racing car, initially at rest, picks up a velocity of 180 kmh−1 in 4.5 s. Calculate
- acceleration
- distance covered by the car.
Interpret the following graph: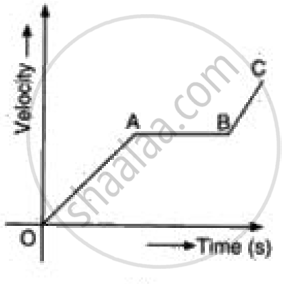
A car accelerates to a velocity of 30 m/s in 10 s and then decelerates for 20 s so that it stops. Draw a velocity-time graph to represent the motion and find:
The acceleration.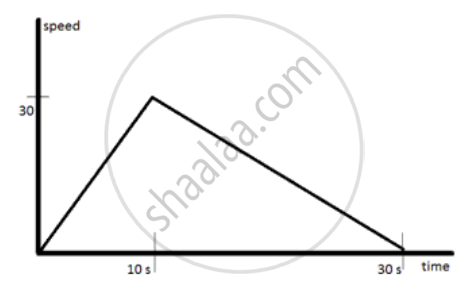
A car starts from rest and it is travelling with a velocity of 20 m/s in 10 s. What is its acceleration?
The slope of a velocity-time graph gives ______.
An object can be moving with uniform speed but with variable acceleration.
