Advertisements
Advertisements
प्रश्न
Draw a graph for acceleration against time for a uniformly accelerated motion. How can it be used to find the change in speed in a certain interval of time?
Advertisements
उत्तर

The area enclosed between the straight line and time axis for each interval of time gives the value of change in speed in that interval of time.
APPEARS IN
संबंधित प्रश्न
Draw velocity – time graph for the following situation:
When a body is moving with variable velocity and variable acceleration.
Diagram is given below shows velocity – time graph of car P and Q, starting from the same place and in the same direction. Calculate the Acceleration of car P.

Distinguish between uniformly and non-uniformly accelerated motions.
Out of energy and acceleration, which one is a vector?
Convert the following acceleration:
1/36 m/s2 into km/h2
A car accelerates to a velocity of 30 m/s in 10 s and then decelerates for 20 s so that it stops. Draw a velocity-time graph to represent the motion and find:
The acceleration.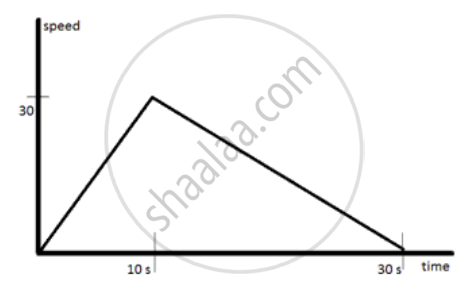
The Unit of acceleration is ______.
A boy throws a ball up and catches it when the ball falls back. In which part of the motion the ball is accelerating?
It is possible to have objects moving with uniform speed but variable acceleration.
When a body is said to be in
- uniform acceleration
- non–uniform acceleration?
