Advertisements
Advertisements
Question
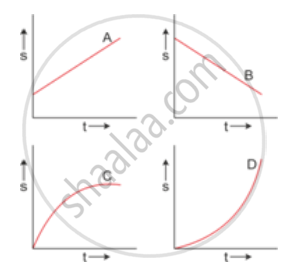
The figure shows the displacement - time graph for four bodies A, B C and D. In each case state what information do you get about the acceleration (zero, positive or negative).
Advertisements
Solution
For body A: The graph is a straight line. So, the slope gives constant velocity. Hence, the acceleration for body A is zero.
For body B: The graph is a straight line. So, the slope gives constant velocity. Hence, the acceleration for body B is also zero.
For body C: The slope of the graph is decreasing with time. Hence, the acceleration is negative.
For body D: The slope of the graph is increasing with time. Hence, the acceleration is positive.
APPEARS IN
RELATED QUESTIONS
Which of the two can be zero under certain conditions : average speed of a moving body or average velocity of a moving body ?
A cheetah starts from, rest, and accelerates at 2 m/s2 for 10 seconds. Calculate :
(a) the final velocity
(b) the distance travelled.
A train travelling at 20 m s-1 accelerates at 0.5 m s-2 for 30 s. How far will it travel in this time ?
The slope of a speed-time graph gives:
Differentiate between uniform acceleration and variable acceleration.
Multiple choice Question. Select the correct option.
The speed of a car reduces from 15 m/s to 5 m/s over a displacement of 10 m. The uniform acceleration of the car is :
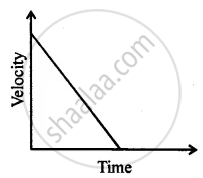
Can you suggest a real-life example about the motion of a body from the following velocity – time graph?
A stone thrown vertically upwards takes 3 s to attain maximum height. Calculate
- initial velocity of the stone
- maximum height attained by the stone. (Take g = 9.8 ms−2)
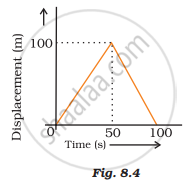
A girl walks along a straight path to drop a letter in the letterbox and comes back to her initial position. Her displacement–time graph is shown in Fig.8.4. Plot a velocity-time graph for the same.
An object starting from rest travels 20 m in the first 2 s and 160 m in the next 4 s. What will be the velocity after 7 s from the start?
