Advertisements
Advertisements
Question
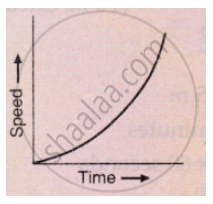
What conclusion can you draw about the acceleration of a body from the speed-time graph shown below .
Advertisements
Solution
It represents non-uniform acceleration. In this kind of motion, speed doesn’t vary linearly with time.
APPEARS IN
RELATED QUESTIONS
Derive the following equation of motion by the graphical method : v2 = u2 + 2as, where the symbols have their usual meanings.
Multiple choice Question. Select the correct option.
The slope of displacement – time graph represents.
From the velocity – time graph given below, calculate Distance covered in the region ABCE.

The graph of one quantity versus another result in a straight line. How are the quantities related to each other?
Draw the speed-time graph of a body starting from some point P, gradually picking up speed, then running at a uniform speed and finally slowing down to stop at some point Q.
What can you say about the nature of motion of a body of its displacement-time graph is:
A straight line inclined to the time axis with an acute angle?
Draw distance-time graph to show:
Uniform velocity
Saphira moves at a constant speed in the same direction. Rephrase the same sentence in fewer words using concepts related to motion.
Mention the uses of the velocity-time graph.
If the velocity-time graph has the shape AMB, what would be the shape of the corresponding acceleration-time graph?

