Advertisements
Advertisements
प्रश्न
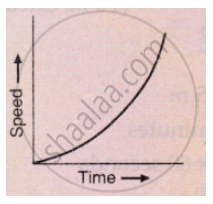
What conclusion can you draw about the acceleration of a body from the speed-time graph shown below .
Advertisements
उत्तर
It represents non-uniform acceleration. In this kind of motion, speed doesn’t vary linearly with time.
APPEARS IN
संबंधित प्रश्न
A car of mass 1000 kg is moving with a velocity of 10 m s−1. If the velocity-time graph for this car is a horizontal line parallel to the time axis, then the velocity of car at the end of 25 s will be :
Multiple choice Question. Select the correct option.
The slope of displacement – time graph represents.
Draw velocity – time graph for the following situation:
When a body is moving with variable velocity, but uniform acceleration.
Diagram shows a velocity – time graph for a car starting from rest. The graph has three sections AB, BC and CD.

From a study of this graph, state how the distance travelled in any section is determined.
Diagram is given below shows velocity – time graph of car P and Q, starting from the same place and in the same direction. Calculate at what time intervals both cars have the same velocity?

How will you use a speed-time graph to find whether the acceleration of the body is uniform or not?
Draw the following graph:
Speed versus time for a stepped motion
What can you say about the motion of a body if:
Its time-velocity graph is a straight line
Draw velocity-time graph to show:
Deceleration
Write a sentence to explain the shape of graph.
Saphira moves at a constant speed in the same direction. Rephrase the same sentence in fewer words using concepts related to motion.
