Advertisements
Advertisements
प्रश्न
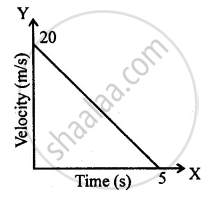
Diagram shows a velocity – time graph for a car starting from rest. The graph has three sections AB, BC and CD.

From a study of this graph, state how the distance travelled in any section is determined.
Advertisements
उत्तर
The area under the x-axis gives distance travelled.
APPEARS IN
संबंधित प्रश्न
What is the quantity which is measured by the area occupied below the velocity-time graph?
Fill in the following blank with suitable word :
In a speed-time graph, the area enclosed by the speed-time curve and the time axis gives the…………….. by the body.
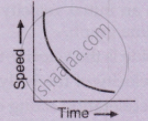
What type of motion is represented by the following graph ?
A car of mass 1000 kg is moving with a velocity of 10 m s−1. If the velocity-time graph for this car is a horizontal line parallel to the time axis, then the velocity of car at the end of 25 s will be :
Draw a displacement-time graph for a boy going to school with uniform velocity.
What does the slope of velocity-time graph represent?
Multiple choice Question. Select the correct option.
In the velocity-time graph, the acceleration is
The graph of one quantity versus another result in a straight line. How are the quantities related to each other?
Figure shows displacement- time graph of two objects A and B moving in a stra ight line. Which object is moving fa ster?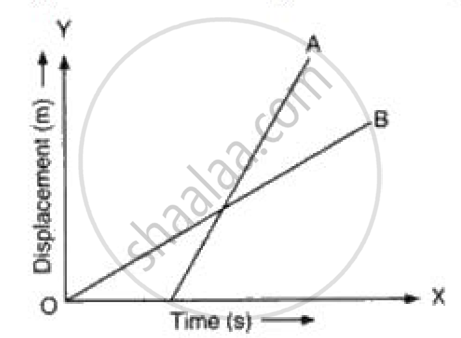
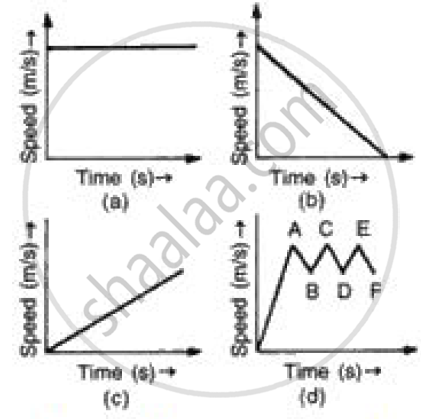
(i) In speed time graph uniform motion is given by a straight line parallel to x axis so figure (a) denotes the uniform motion.
(ii) In speed time graph motion with increasing speed is shown by straight line with positive slope so figure (c) denotes the motion with speed increasing.
(iii) In speed time graph motion with decreasing speed is shown by straight line with negative slope so figure (b) denotes the motion with speed decreasing.
(iv) In speed time graph motion with oscillating speed is shown by zigzag line so figure {d) denotes the motion with speed oscillating.
