Advertisements
Advertisements
Question
Diagram shows a velocity – time graph for a car starting from rest. The graph has three sections AB, BC and CD.

From a study of this graph, state how the distance travelled in any section is determined.
Advertisements
Solution
The area under the x-axis gives distance travelled.
APPEARS IN
RELATED QUESTIONS
Show by using the graphical method that: `s=ut+1/2at^2` where the symbols have their usual meanings.
A body is moving uniformly in a straight line with a velocity of 5 m/s. Find graphically the distance covered by it in 5 seconds.
What type of motion is represented by the following graph ?
A ball is thrown up vertically and returns back to thrower in 6 s. Assuming there is no air friction, plot a graph between velocity and time. From the graph calculate
- deceleration
- acceleration
- total distance covered by ball
- average velocity.
From the velocity – time graph given below, calculate Distance covered in the region ABCE.

Draw the following graph:
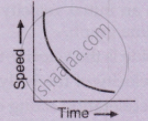
Speed versus time for a non-uniform acceleration.
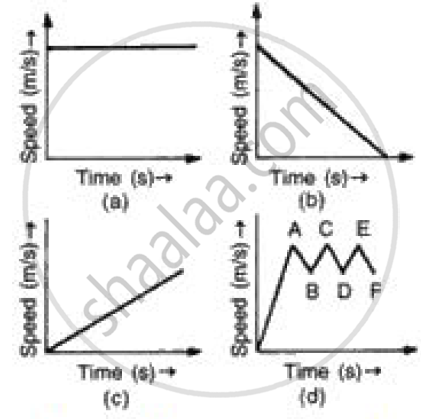
(i) In speed time graph uniform motion is given by a straight line parallel to x axis so figure (a) denotes the uniform motion.
(ii) In speed time graph motion with increasing speed is shown by straight line with positive slope so figure (c) denotes the motion with speed increasing.
(iii) In speed time graph motion with decreasing speed is shown by straight line with negative slope so figure (b) denotes the motion with speed decreasing.
(iv) In speed time graph motion with oscillating speed is shown by zigzag line so figure {d) denotes the motion with speed oscillating.
State whether true or false. If false, correct the statement.
The velocity – time graph of a particle falling freely under gravity would be a straight line parallel to the x axis.
The area of the velocity-time graph gives the displacement of the body.
The velocity-displacement graph describing the motion of a bicycle is shown in the figure.

The acceleration-displacement graph of the bicycle's motion is best described by:
