Advertisements
Advertisements
Question
Show by using the graphical method that: `s=ut+1/2at^2` where the symbols have their usual meanings.
Advertisements
Solution
Suppose the body travels a distance (s) in time (t).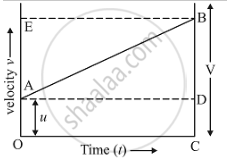
In the figure, the distance travelled by the body is given by the area of the space between the velocity-time graph AB and the time axis OC, which is equal to the area of the figure OABC.
Thus: Distance travelled = Area of the trapezium OABC
But, Area of the figure OABC = Area of rectangle OADC + Area of triangle ABD
= Area of rectangle OADC + area of triangle ABD
Now, find out the area of rectangle OADC and area of triangle ABD.
(i) Area of rectangle OADC
= (OA) (OC)
= (u) (t)
(ii) Area of triangle ABD,
= (1/2)(AD)(BD)
= (1/2)(t)(at)
= (1/2)at2
Distance travelled (s) is,
So, s = Area of rectangle OADC + Area of triangle ABD
`s = ut + 1/2at^2`
This is the second equation of motion.
Where
(s) - Displacement
(u) - Initial velocity
(a) - Acceleration
(t) - Time
APPEARS IN
RELATED QUESTIONS
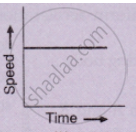
What can you say about the motion of a body if its speed-time graph is a straight line parallel to the time axis ?
Derive the following equation of motion by the graphical method : v2 = u2 + 2as, where the symbols have their usual meanings.
The speed-time graph of an ascending passenger lift is given alongside. What is the acceleration of the lift:
(1) during the first two seconds ?
(2) between second and tenth second ?
(3) during the last two seconds ?
What type of motion is represented by the following graph ?
What type of motion is represented by the following graph ?
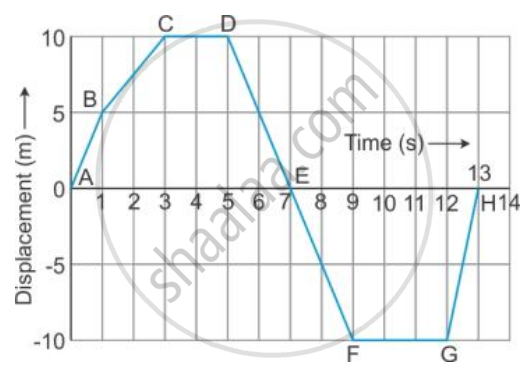
From the displacement-time graph of a cyclist given below in the Figure, find The time after which he reaches the starting point .
Draw the following graph:
Distance versus time for a body at rest.
Draw the following graph:
Speed versus time for a fluctuating speed.
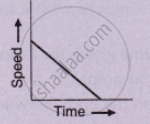
Which of the following graphs represents a motion with negative acceleration?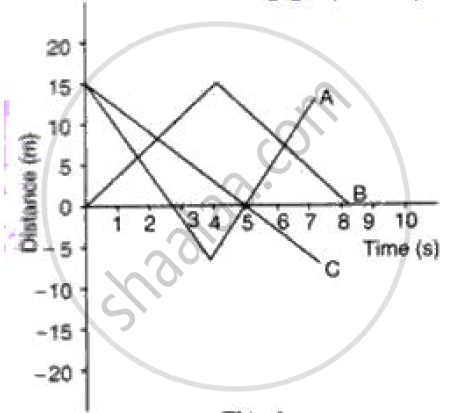
Slope of the velocity-time graph gives ______.
