Advertisements
Advertisements
Question
Draw the speed-time graph of a body when its initial speed is not zero and the speed increases uniformly with time.
Advertisements
Solution

Speed time graph of a body when itS Initial speed is not ze ro and and speed increase uniformly with time.
APPEARS IN
RELATED QUESTIONS
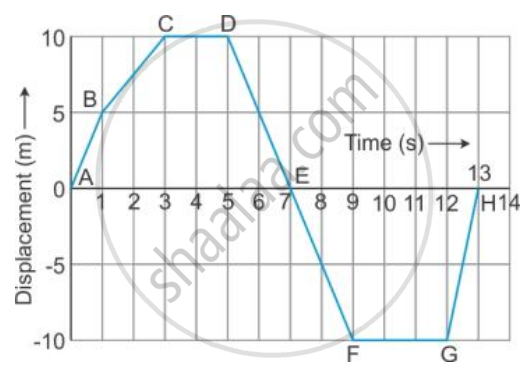
From the displacement-time graph of a cyclist given below in the Figure, find The time after which he reaches the starting point .
A body at rest is thrown downward from the top of the tower. Draw a distance – time graph of its free fall under gravity during the first 3 seconds. Show your table of values starting t = 0 with an interval of 1 second, (g = 10 ms−2).
Name the physical quantity which is equal to the area under speed-time graph.
Draw the speed-time graph of a body starting from some point P, gradually picking up speed, then running at a uniform speed and finally slowing down to stop at some point Q.
What can you conclude if the speed-time graph of a body is a curve moving upwards starting from the origin?
Draw velocity-time graph to show:
Zero acceleration
Write a sentence to explain the shape of graph.
Figure shows the velocity-time graphs for two objects A and B moving in same direction . Which object has the greater a cceleration?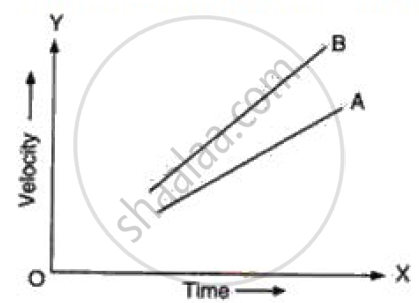
Figure shows the distance-time graph of three students A, B and C. On the basis of the graph, answer the following :
When B meets A, where is C?
The area under the v-t graph represents a physical quantity that has the unit.
A straight line parallel to the x-axis in the velocity-time graph represents the object moving in ______.
